Team
| Team Member | Major |
| Amanda Pignataro | B.S. in Data Science |
| Avery Girksy | B.S. in Data Science |
| Ryan Hilton | B.S. in Data Science |
| Vaarya Srivastava | B.S. in Data Science |
Mentor
Prof. Cantay Caliskan , Goergen Institute for Data Science
Sponsor
University of Rochester Corporate Purchasing:
Katherine Sadoff-Herrick, Neil Pierce, Jeff Meteyer, Carl Tietjen, Wen Li, Ph.D.
Introduction
Procurement is the process of acquiring goods or services from an outside source. [1] Approximately $600 billion is spent each year by public and private universities, collectively, and many experience challenges when identifying cost efficient suppliers. Specifically, the Procurement Department at the University of Rochester is hoping to determine cost containment opportunities. Thus, strategic modeling and price auditing will be implemented to understand and leverage the department’s full buying power.
Our project is motivated by the University of Rochester’s desire to enhance analytics of non-clinical spend data. Through cost-saving measures, the University of Rochester could redirect funding towards improving student life and increasing student opportunities.
Project Objectives
-
Leverage UR Purchasing’s full buying power
- Achieved through: Exploratory Data Analysis and Clustering
-
Recognize best Cost and Value for cost containment opportunities
- Achieved through: Price Auditing Algorithm
-
Understand the impact of inflation
- Achieved through: Comparing data to external benchmarks
Dataset Overview
- Main dataset or may be referred to as ‘Procurement Capstone‘:
- 75 Columns and 297,082 Rows
- Each row is item or product from an invoice
- 25 Quantitative, 50 Qualitative Features
- Data ranging from January 2020- January 2023
- Example Data:
Field Label
Example Data
Company
River Campus Colleges
Supplier
W B Mason Co Inc
Line Description
Dazzling Copy Paper
UNSPSC
14110000
Unit of Measure
Carton
Invoice Date
2022-06-30
Distribution Quantity
4.0
Distribution Extended Amount
138.00
- Additional datasets:
- Contracting pricing datasets for 8 suppliers
- UNSPSC conversion dataset
- Benchmark pricing datasets obtained from the Bureau of Labor Statistics
Exploratory Data Analysis
To summarize the main characteristics of our various datasets, we conducted exploratory data analysis (EDA).
The following are key details and features that arise in the Procurement Capstone dataset:
- Company: High-level internal operational unit of the University of Rochester
-
- 14 Unique Values
- Most frequent: School of Medicine and Dentistry
-
- Supplier: External company that provides products or services to UR companies
- 35 Unique Values
- Most Frequent: Staples Business Advantage
- Highest Spend: Wesco Distribution
-
Spend Category: Classification of an item by the UR Purchasing team
-
122 Unique Values
-
Most frequent: Office Supplies and Laboratory Supplies
-
EDA Visualization
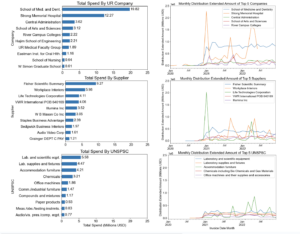
The left visualizations depict the sum of ‘Distribution Extended Amount’ for the top ten Companies, Suppliers, and UNSPSC. The right visualizations indicate the top five Companies, Suppliers, and UNSPSC over time (by month).
Feature Engineering
1. UNSPSC: United Nations Standard Products and Services Code
- From dataset provided by UR Purchasing, converted UNSPSC codes to names
- Successful on 96.37% of present UNSPSC codes
2. Distribution Unit Cost: Defined as Dist. Total Amt. / Dist. Qty.
-
- This generated feature reflects the company spend per unit on an invoice line
-
‘Distribution Total Amount’: Best measure of the company spend per invoice line
-
‘Distribution Quantity’: Number of units per invoice line
Clustering
The goal behind clustering is to segment distinct groups or clusters within a dataset. Within this project, clustering was implemented to better understand what groups, such as suppliers, companies, or family titles were the most significant to our analysis. [2] For example, RFM analysis was conducted to identify which of these groups were important based on their recency, frequency, and monetary value.
RFM Analysis
This technique denotes the number of days since the last product invoice was raised, the number of transactions or purchases in a time period and how much money was spent on this purchase.
It was advantageous to use this on the ‘Family Title’ of our products. ‘Family Title’ denotes a commonly recognized group of inter-related commodity categories under the UNSPSC conversion data. With the results obtained from clustering based on this category, we can effectively shift our focus to the groups that have the most spend or frequent purchases.
For example, “Paper products” is a family title, belonging to the segment title of “Paper Materials and Products”.
Here we implement RFM analysis on the merged procurement capstone and UNSPSC dataset to segment groups using K-Means clustering:
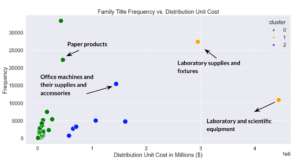
- Cluster 0 or Low Spenders: ‘Family Title’ with low distribution unit costs, recent purchases, and not frequent purchases
- Cluster 1 or High Spenders: ‘Family Title’ with high distribution unit costs, somewhat recent purchases, and somewhat frequent purchases
- Cluster 2 or Medium Spenders: ‘Family Title’ with intermediate distribution unit costs, somewhat recent purchases, and frequent purchases
This analysis provides the motivation behind implementing specific benchmark pricing, which is discussed below.
Contract Pricing
- UR Purchasing has negotiated contracts with seven suppliers to reduce costs on high spend items
- Beckman Coulter, WB Mason, VWR International (2022, 2023), Henry Schein, Thermo Fisher Scientific, Agilent, Bio Rad Laboratories (2022, 2023)
- Contracts include an item identifier and contracted price
- May also include unit of measure specification and/or time designation
- Example Contract for Dazzling Copy Paper:
- WB Mason Co Inc Contract Line:
Item Number
Description
Price
UOM
RBB61200
PAPER
$34.50
CT
- Procurement Capstone Invoice Line:
- WB Mason Co Inc Contract Line:
|
Supplier Item Identifier |
Distribution Quantity |
Distribution Extended Amount |
Unit of Measure |
|
RBB61200 |
4.0 |
$138.00 |
Carton |
-
- Combined Contract and Invoice Line:
|
Contract Price |
Distribution Unit Cost |
|
$34.50 |
$34.50 |
Percent Difference
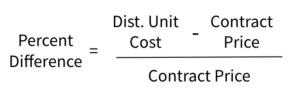
We seek to analyze both the absolute and percent difference between the distribution unit cost and the contract price. The following equation is applied to determine the percent difference.
Benchmark Pricing
To gain insight on the true cost that UR Purchasing encounters through their procurement, it is imperative to compare their prices to external benchmarks. The primary motivations behind this are as follows:
- Compare the amount UR Purchasing pays against external benchmarks.
- Understand the impact of inflation by product through benchmarking prices.
- Provide leverage when negotiating prices with suppliers.
- Purchase goods/services and create contracts with more confidence.
With these, a Benchmark Function was established to achieve a specific benchmark price for each product that UR Purchasing buys:
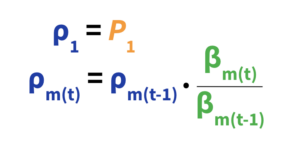
-
- P1 is price of first item purchase in our data. ρ is a corresponding item benchmark price for P.
- β is the monthly benchmark price for a family of goods.
- ρm(t) will be used for all purchases of an item where its invoice date t is closest to month m.
With the application of the benchmark function, various benchmark prices were established. The below plot represents an example benchmark price for ‘Paper Products’ against the UR Purchasing price for ‘Dazzling Copy Paper’:
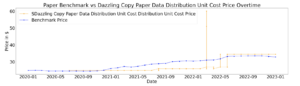
‘Paper Products’ benchmark and ‘Dazzling Copy Paper’ product prices follow similar trends but we see a recent increase. As of December 2022, UR Purchasing is paying more than benchmark.
This data will become actionable for UR Purchasing if the product price consistently exceeds the benchmark over time.
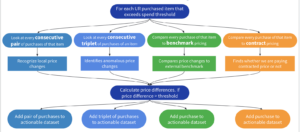
Price Auditor
The critical motivation behind establishing a price auditing algorithm was to recognize inefficient purchasing. The algorithm aims to answer the following questions:
- Did multiple UR companies buy the same item or did multiple suppliers sell the same item to UR at different prices?
- Did a supplier increase/decrease the price of an item?
- Did a UR company pay more than contracted or industry standard price?
Functionality of the algorithm:
The following flowchart exhibits the capabilities of our price auditing algorithm:
Measure of Loss/Gain
To determine the amount of spend that could be considered a loss or gain, we use the following idea and function:
- ‘Rate Variance’ denotes the change in price and its impact on total cost of goods purchased. Calculating rate variance is shown:
Rate Variance =(Actual Price – Expected Price) * Actual Quantity
Price Auditor Incorporation:
- Pairs: (Pricet – Pricet-1) * Quantityt
- Triplets: (Pricet – Pricet-1) * Quantityt
- Benchmarks: (Pricet – ρm(t)) * Quantityt
- Contract: (Pricet – κc(t)) * Quantityt
κc(t) is the contract price for an item at time t
- Example implementation of Rate Variance in our data:
|
Field Label |
Example Data (t-1,t) |
|
Line Description |
FB NITRILE GLV PF LF S 100/PK (Safety Gloves) |
|
Distribution Total Amount |
(220.0, 600.0) |
|
Distribution Quantity |
(1.0, 2.0) |
|
Distribution Unit Cost |
(220.0, 300.0) |
|
Rate Variance |
160.0 |
Consecutive Pairs and Triplets Results
Consecutive Pairs
Incorporating consecutive pairs provides us the ability to analyze local price changes in items and find anomalous transaction. Here are the results after implementing consecutive pairs:
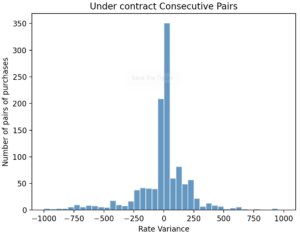
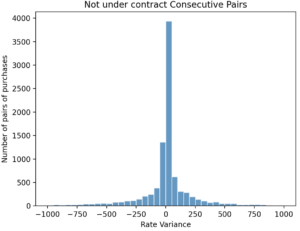
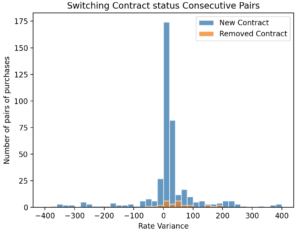
- Sterling Exam Gloves (100pk) had one of the highest rate variances overall at ~$3000, suggesting significant price increase
- Rate variance of consecutive pairs under contract is more variable than consecutive pairs not under contract
- More likely to pay more when both switching into and out of contract
Consecutive Triplets
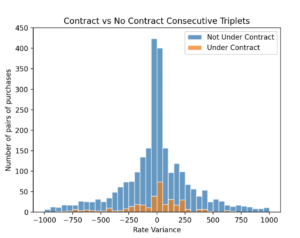
- More total anomalies for non contract items than contract items
- Distributions are roughly symmetric
- 5% of items in dataset are under contract but 11% of anomalies are from items under contract
- Alcohol Prep Pads 200/pk had highest total rate variance of ~$2000 of anomalous purchases
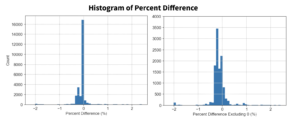
Contract Comparison Function
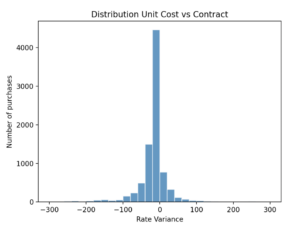
- Distribution skewed negatively means we are more likely to pay less than contracted price
- FB NITRILE GLV PF LF S 100/PK (Safety Gloves) had the highest rate variances at ~$5500 in 2022 over many purchases
Conclusion
Through price analysis, we found price variations between the vendor data and the contract and benchmark data. Also, we implemented clustering algorithms to produce segments of clients with similar spending behaviors and distinguish top groups with high spend. Lastly, our price auditing algorithm determined the amount of purchases in which UR Purchasing has overpaid for goods or services. Below we discuss the limitations of our work as well as future steps that could be taken.
Limitations
The scope at which we could conduct analysis on the pricing data supplied by the UR Purchasing team were limited based on various factors. First, regarding the benchmark price, our work was limited by the absence of specific benchmark data on a per-product basis. Benchmarks may also be discontinued or non-current. Additionally, the contract price data was useful, however, there was minimal contract data for each supplier used by UR Purchasing for 2022 transactions. Lastly, the price auditing algorithm was limited by minimal knowledge of the parameters to which a products price was fair for those products not under contract.
Future Work
To further extend the possibilities of this project, UR Purchasing could create an API, dashboard interface, and enhance the scope of contract pricing. First, an Application Programming Interface (API) could be an effective future step that would allow UR Purchasing to have an interactive dashboard. Users could interact with a dashboard interface by using a drop-down menu for specific product and understand their details, such as determining the price we paid for a product vs. the contract price of a specific year. Lastly, UR Purchasing can negotiate new contracts by automatically comparing the contract price to what they have actually paid in the past.
Acknowledgements
We would like to especially thank…
- The UR Purchasing team for their willingness to collaborate, their support, and the trust placed in our group
- Professors Caliskan and Anand for their efforts, advice, and encouragement
- The Goergen Institute for Data Science for its continued academic and professional support
References
- National Center for Education Statistics. “Fast Facts: Educational Attainment.” NCES, Institute of Education Sciences, U.S. Department of Education, 2021, https://nces.ed.gov/fastfacts/display.asp?id=75
- Mousavifar, Ehsan. “Exploring Customers Segmentation with RFM Analysis and K-means Clustering.” Medium, 9 Jan. 2020, https://medium.com/swlh/exploring-customers-segmentation-with-rfm-analysis-and-k-means-clustering
- Indiana Department of Administration, Procurement Division. “UNSPSC Commodity Codes.” Indiana Government, https://www.in.gov/idoa/procurement/files/unspsc1.pdf.
- 8020 Consulting, Understanding the impact of Volume, Mix, and Rate on Manufacturing COGS Variance. https://8020consulting.com/manufacturing-cogs-variance-volume-mix-rate/