Team
Walter Burnett
Derek Caramella
Ezgi Siir Kibris
Nefle Nesli Oruc
Mentor
Ajay Anand
Project Sponsor
URMC
Primary Contact: Jon Herington
Abstract
This project aims to observe, visualize, and model the trends in which COVID-19 patients at the University of Rochester Medical Center were allocated ventilators. Descriptive analyses are performed to investigate the relationships between variables such as but not limited to recovery rate and length of ventilator allocation and gender, race, and age. These relationships are visualized on a web-hosted dynamic dashboard. After data preprocessing, predictive analyses on ventilator allocation trends are performed, modeling the data by implementing Random Forest, Decision Tree, SVM, and Logistic Regression algorithms in Python.
Introduction and Motivation
During the COVID-19 pandemic, many hospitals faced ventilator shortages responding to an exponential increase in patients. Consequently, administrative committees developed priority systems to allocate hospital resources effectively. This study examines the (1) trends in patients and allocation of ventilators, (2) whether the current priority system accurately reflects the success rate of medical intervention, and (3) whether socioeconomic biases and demographic disparities exist in priority modules and survival outcomes, at the University of Rochester Medical Center (URMC). Additionally, the project seeks to develop a survival outcome prediction model if URMC encounters ventilator scarcity. Logistic regression, SVM, Random Forest, and Decision Tree algorithms will be applied to the ventilator allocation dataset provided by URMC. This study will be reported in the following chapters: Dataset, Exploratory Analysis, Model development, Performance and Results, and Conclusion and Next Steps.
Dataset
Dataset Description
URMC provided the ventilator allocation dataset that contained 15,570 assessment records and five tables: Study Cohort, Admission, Insurance, BLIS Assessment, and COVID Status, which were de-identified for secure personal data processing. The Admission table records a patient’s medical information at the time of the admission, including the reason for visit and diagnosis. The Study Cohort table contains pre-organized information per patient and per encounter that was deemed useful by the department for the ventilator allocation algorithm research, such as race, ethnicity, length of stay, and discharge status. The Insurance table connects patients to their insurance payers, while the COVID Status table reflects information on the patient’s COVID status. Lastly, the BLIS Assessment table archives intubation information per patient, such as vent duration, ventilation priority category (indicated with a color) per assessment, and SOFA (Sequential Organ Failure Assessment) score. SOFA score reflects the extent of organ failure and dysfunction in intensive care units through the number of indicators of organ failure. Table 1 demonstrates the relationship between the SOFA score and the ventilation priority category.

Table 1. SOFA Score
Data Preprocessing
We began our ventilator allocation reducing the data granularity in highly granular features. The race and insurance attributes demonstrated high granularity – Figure 1 reflects the race categories from the raw dataset. We categorized the race attribute into five classes: (1) American Indian or Alaska Native, (2) Asian, (3) Black or African American, (4) Native Hawaiian or Other Pacific Islander, and (5) White. Moreover, insurance was reduced to four classes: (1) Private, (2) Medicare, (3) Medicaid, and (4) Government. This was done according to the standards on race and ethnicity set by the U.S. Office of Management and Budget. [1]
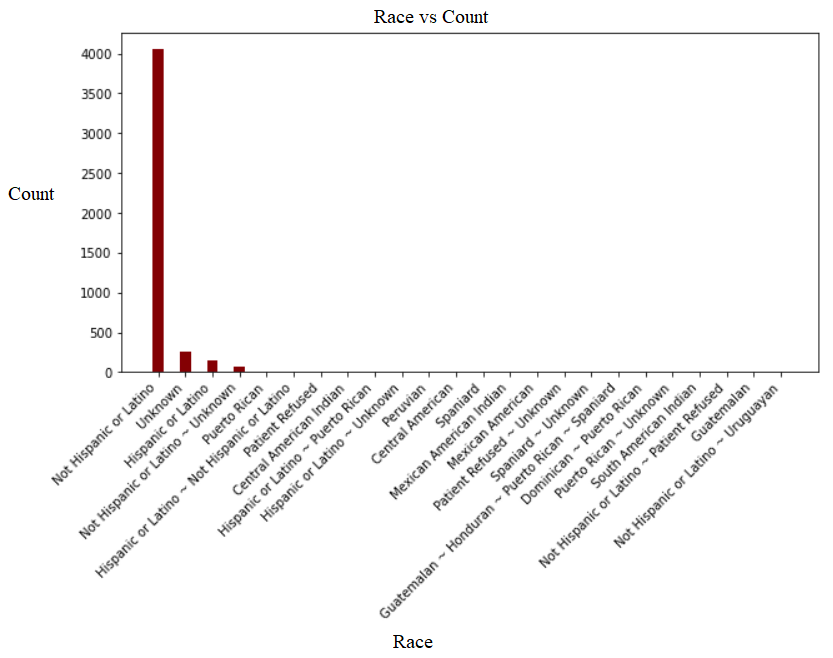
Figure 1. Race Bar Char
The race, ethnicity, sex, discharge status, insurance, and ventilation assessment color categorical features were utilized in the survival outcome model. Additionally, the age attribute was binned in decades to preserve statistical and predictive power.
Next, we merged the tables in the raw dataset to form a SQL data warehouse while selecting the features that will be relevant to the research questions. This step required the primary key fields to be unique and idempotent. One shortfall is the BLIS Assessment table is missing a foreign key for encounters; consequently, patients with multiple encounters with multiple assessments are unable to clearly connect with the BLIS table; thus, the first encounter per patient is used for analysis.
Additionally, because not all patients received the same number of assessments, we considered the assessments that occurred at Day 5 as our mid reference point. Lastly, we one-hot encoded the categorical variables to turn them into numerical values. The final data model is visualized in Figure 2.
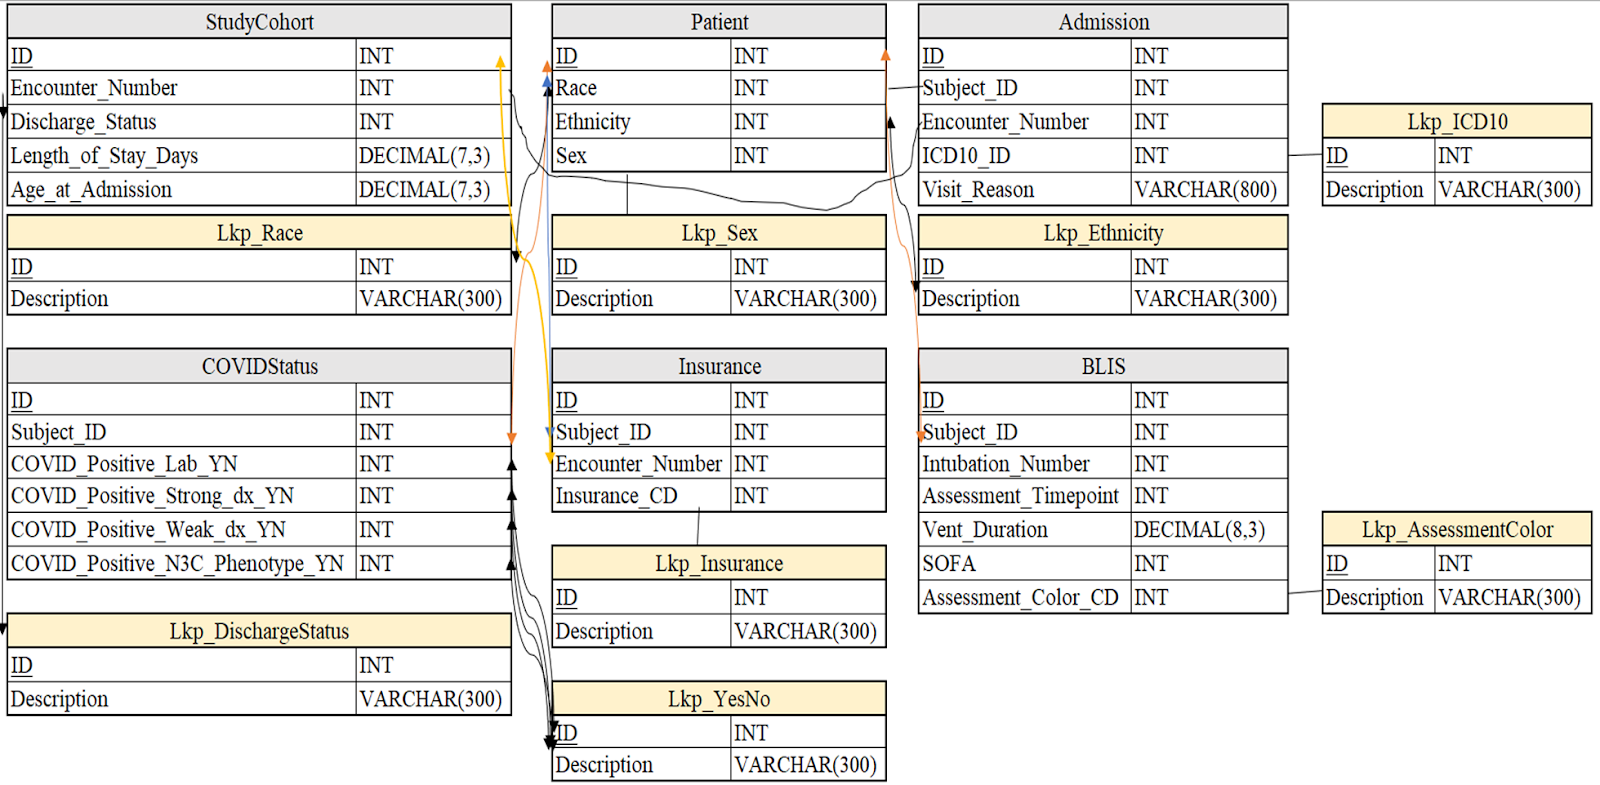
Figure 2. Data Model
There was no missing data apart from the missing foreign key between Encounter Number and BLIS Assessment table.
Exploratory Data Analysis
Before implementing the predictive models, we performed exploratory analyses to further investigate the dataset. Figure 3 shows the mosaic data of different categories. The mosaic graph reveals that there are more males than females, in the dataset. The distribution of races is very similar for male patients, but it is less balanced for female patients. The data also reflects that government insurance is very uncommon for female and male patients.
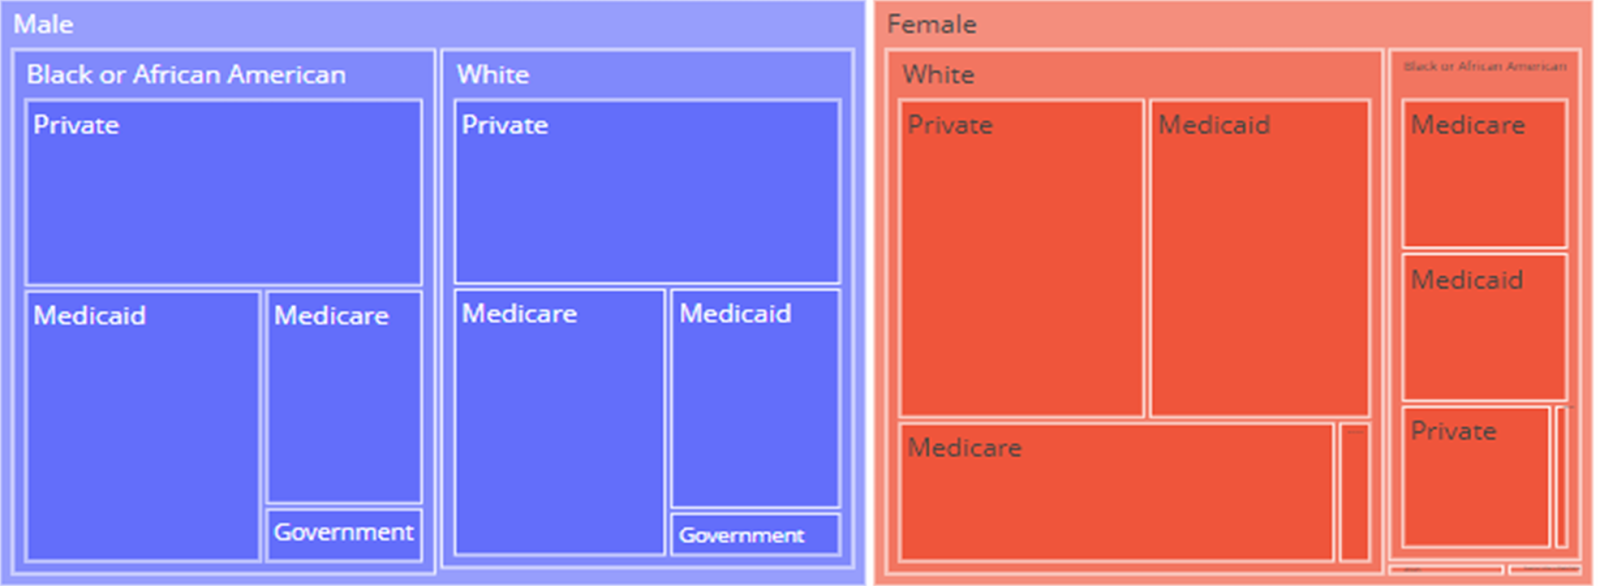
Figure 3. The mosaic plot of data sex, race, ethnicity, gender, and insurance
Figure 4 displays a pie chart for our target variable, Discharge Status. Approximately 75% of patients survived; consequently, a class imbalance exists, hence random prediction of expiry for a patient is statistically less likely to be accurate than a random prediction of survival.
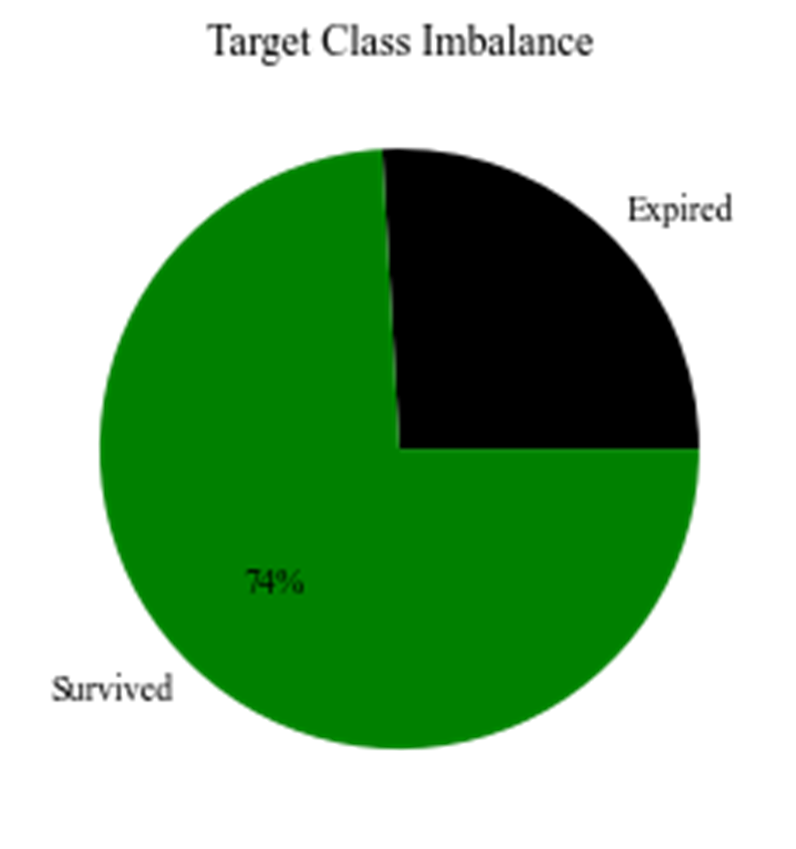
Figure 4. Discharge Status
Figure 5 exhibits a two-dimensional t-SNE dimensionality reduction according to the Discharge Status attribute. The plot displays that no evident clusters exist to predict extubation, suggesting that many factors, perhaps unobserved features, contribute to the final extubation. Although inherent complexity is expected, the model’s accuracy will be dependent on identifying the underlying determinant relationships.
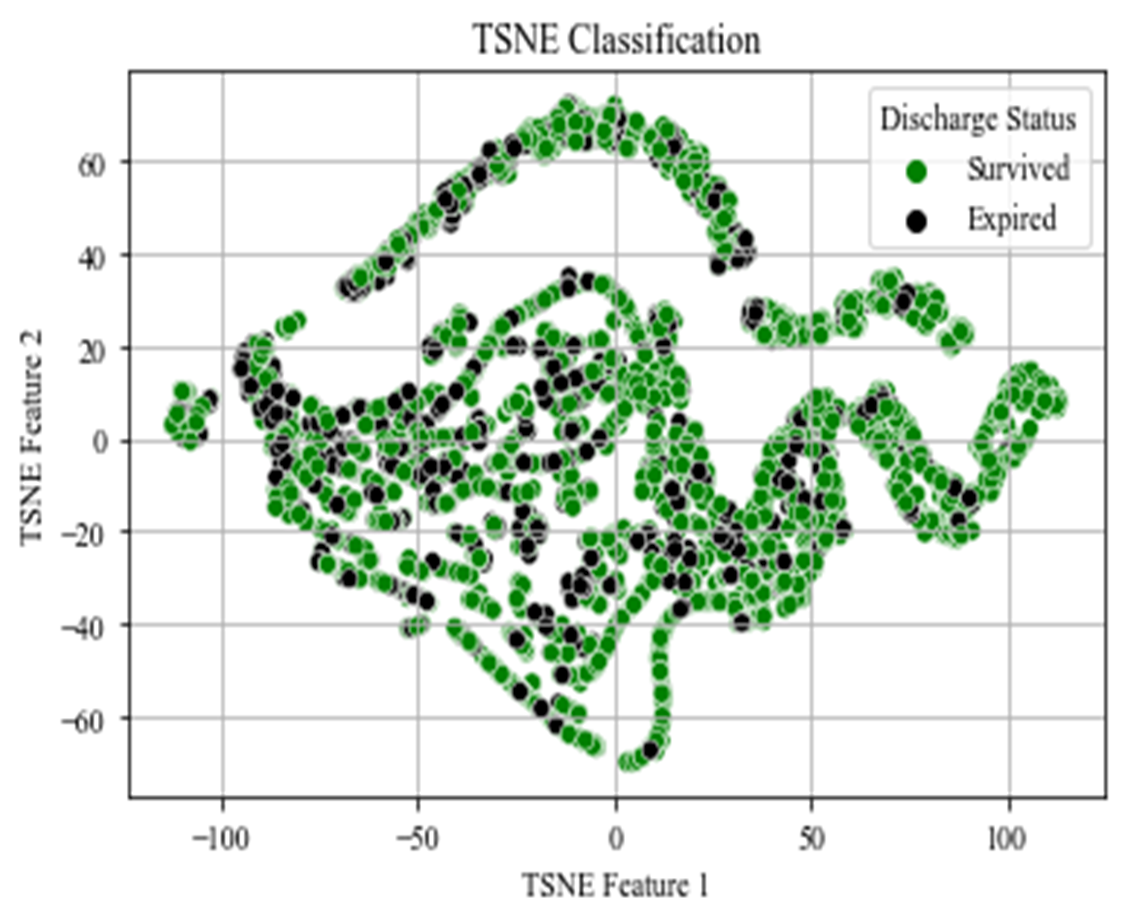
Figure 5. TSNE classification on discharge status
Figure 6 explores the extubation relative to race, sex, and insurance demographic features. Gender does not seem to impact the survival; however, the other demographics were more polarized in terms of discharge status. Analyzing the race bar graph, the heavy disparity between Native Hawaiian or Other Pacific Islander exists due to insufficient representation of the class, one record. Another interesting finding is the imbalance within insurance classes: patients on Private insurance survive more times, while patients on Medicare expire more times.
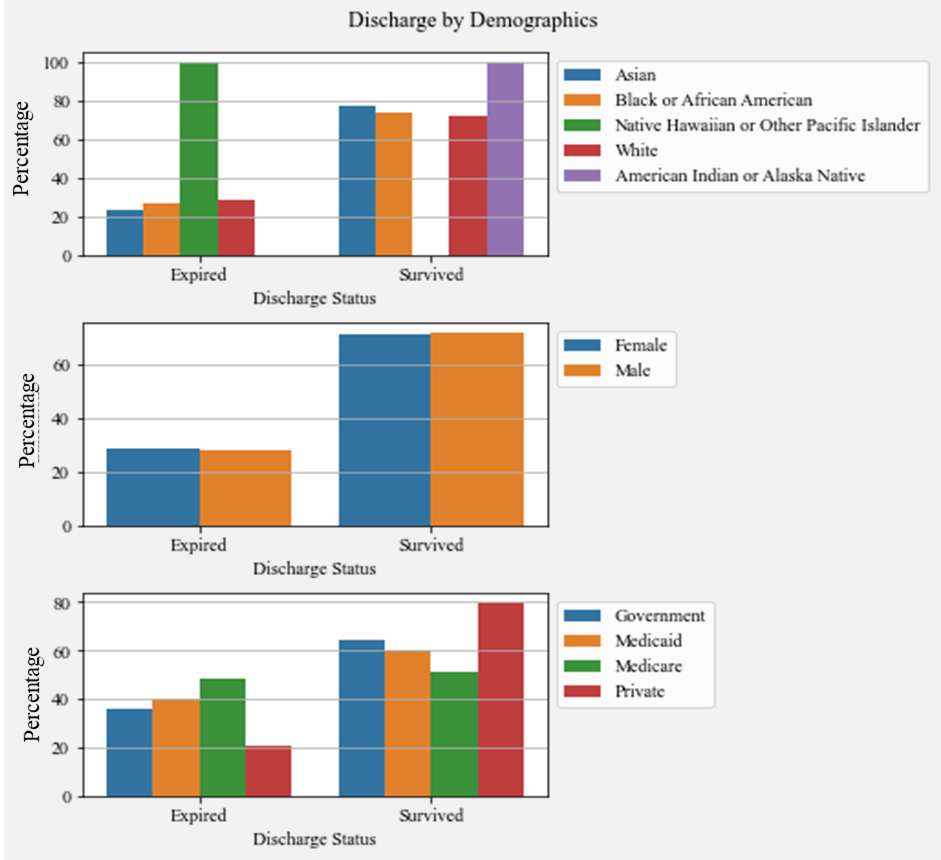
Figure 6. Discharge by Demographics
In a similar fashion, in Figure 7, the relationship between ventilator triage priority and demographics are exhibited. Similar to extubation rates, discrepancies for select races can be observed. Native Hawaiian or Other Pacific Islander and American Indian or Alaska Native patients previously only been assigned the Red priority category. Also, patients with Government insurance have not been assigned the Blue priority category. These hypotheses will be further investigated after the model implementation.
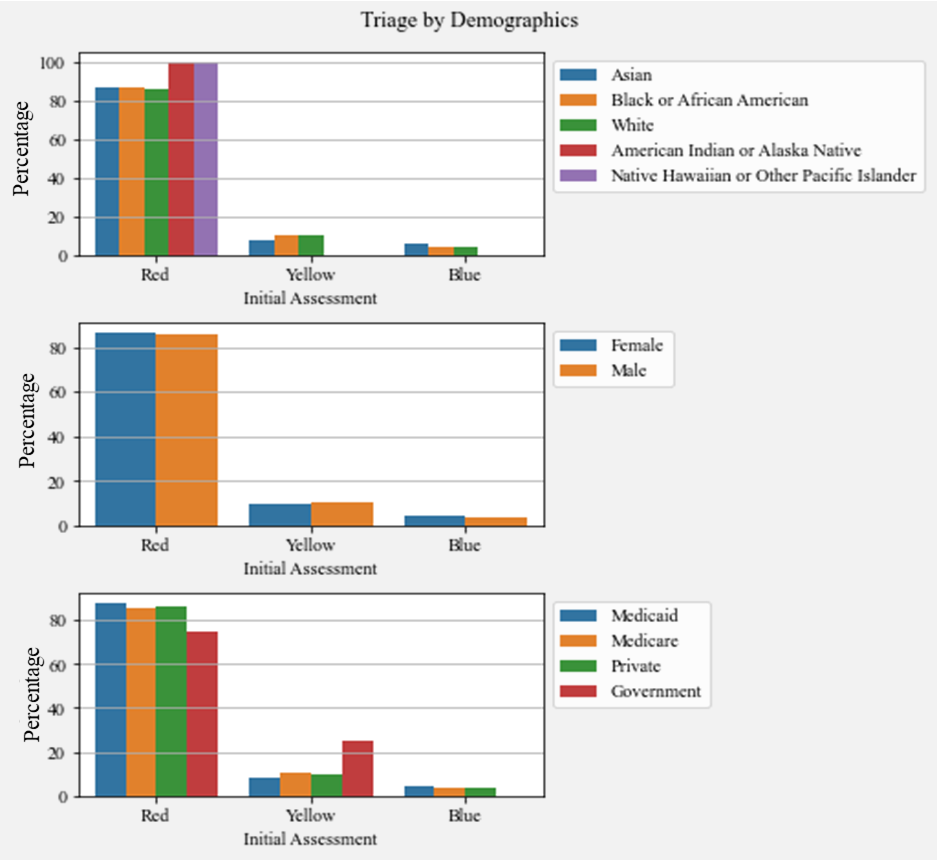
Figure 7. Triage by Demographic
Lastly, Figure 8 contains the Sankey diagram [2] reflecting patient flow between priority categories and the discharge status. The diagram includes the priority assessments taken on Day 0, Day 5, and the final discharge day. The unassessed label represents the patients that were intubated prior to the start of the data collection but were observed on Day 5. Furthermore, the patients that were extubated before Day 5 are given an early Discharge Status at t=5 rather than an assessment color indicating the ventilator priority. The diagram shows that the patients in the Red category are more likely to survive, whereas patients in the Blue category are more likely to expire.
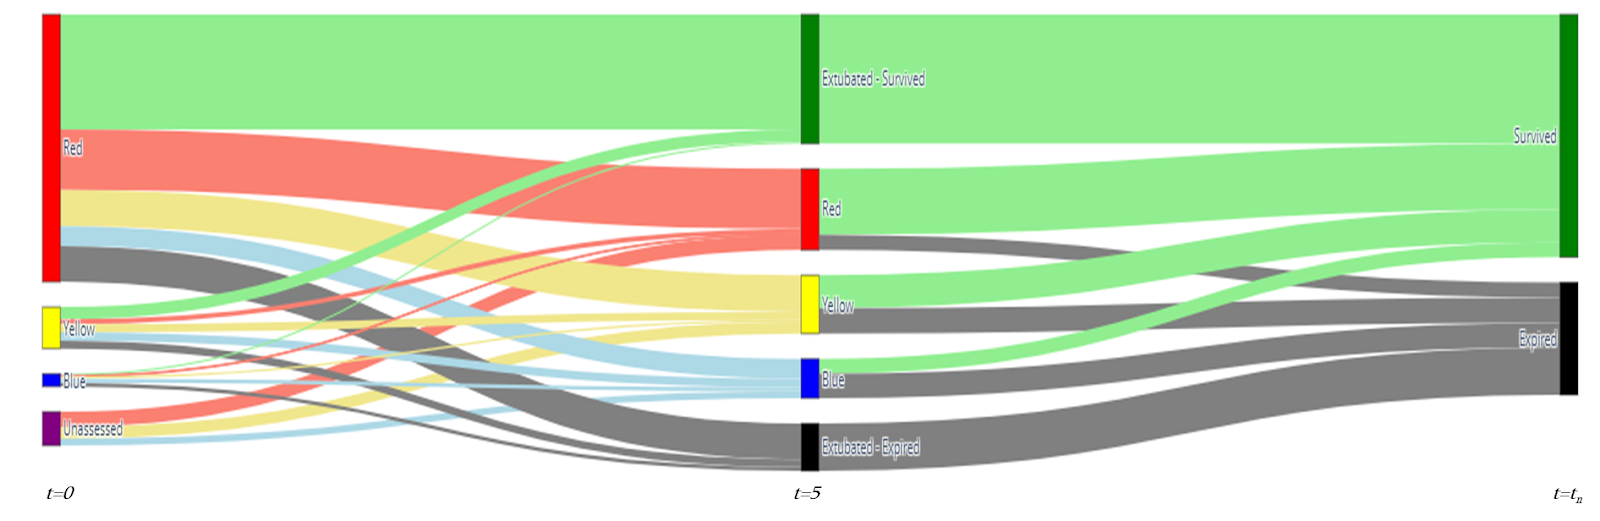
Figure 8. Sankey Diagram of Patient Flow
The above visualizations we complied in an interactive web application, where the user can select different demographic features and SOFA ranges to conduct marginal exploratory analysis. Moreover, Figure 9 represents the input interface containing the editable features by the user to acquire a predicted survival likelihood of a patient.

Figure 9. Web Application Interface
Model Development
The optimal model maximizes these performance metrics’ accuracy, precision, and interpretability. We seek to maximize precision after accuracy because the most costly outcome is a false positive if the patient is going to expire. Still, the model predicts the patient will survive. Finally, we emphasize interpretability because the model will be utilized by medical professionals without an extensive data science background.
We selected four different algorithms to build our model: (1) Decision Tree, (2) Logistic Regression, (3) Random Forest, and (4) Support Vector Machine (SVM), all of which had different trade-offs between simplicity and potential performance. We tuned these models using customized grid searches to find optimal estimators and features for each model. After the grid search, the accuracy, recall, and precision metrics were logged, shown in Table 2. From Table 2, we concluded the Decision Tree (entropy, three levels) algorithm demonstrated optimal results.
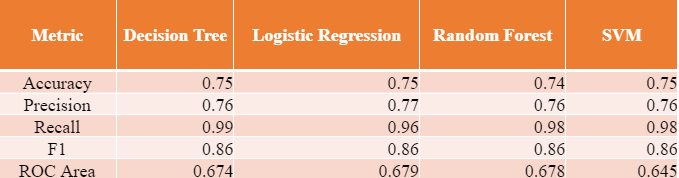
Table 2. Performance Metrics of Different Models
In the extant literature, authors use Monte Carlo simulations [3], XGBoost [4], and Logistic Regression [4] [5]. For the case of Logistic Regression, Keller et al. [5] got 75 % accuracy with age and SOFA score. Our accuracy metrics are also similar to the existing literature.
From Figure 10, we observe the ROC curve for each model, all the models perform comparably. Additionally, the area under the ROC curves (AUC score) was included in the decision process as it indicates the degree of separability, which is important due to our class imbalance.
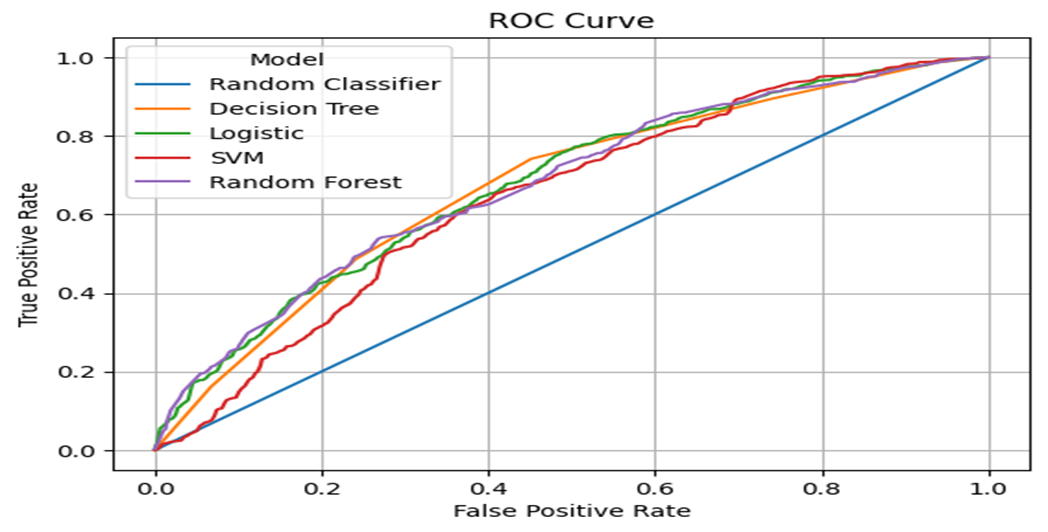
Figure 10. ROC Curves for models
Performance and Results
As the next step in our analysis, the Decision Tree model was further explored and evaluated. Figure 11 represents the Decision Tree’s splitting nodes that reflect the process of an unknown record at different levels and arriving at a classification. It is interesting that the model split the survival likelihood based on Medicaid for patients who were above 75 and assessed with Blue, while the Medicaid coverage doesn’t change the model outcome, the two leaf nodes contain different likelihoods.
It was a priority for our team to make the decision-making process of our models understandable and accessible for the potential users of the model, which is made possible with the implementation of the Decision Tree algorithm.
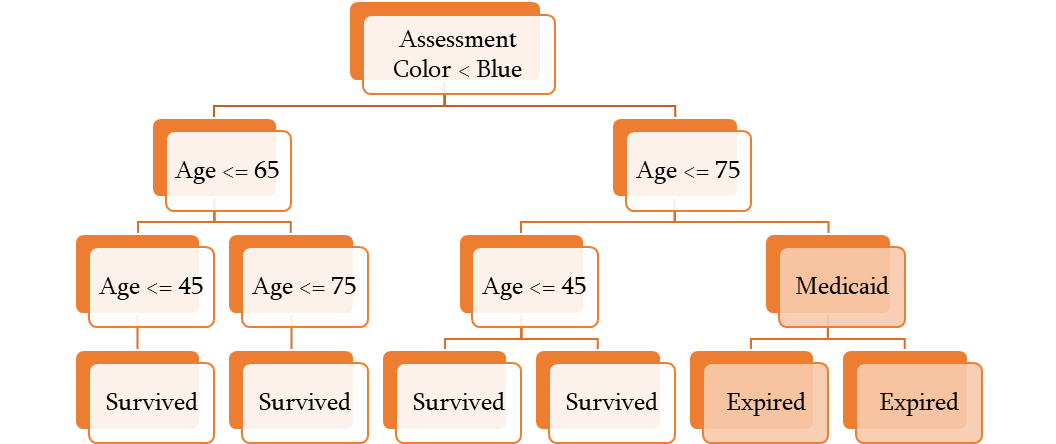
Figure 11. Decision Tree Model and Splitting Nodes
The confusion matrix for the Decision Tree algorithm is depicted in Figure 12; it shows that our model performed very well at predicting true positives, it struggled to predict true negatives, producing false positive predictions. This result is expected to an extent since the input dataset had three times as many surviving patients compared to the expiring patients.
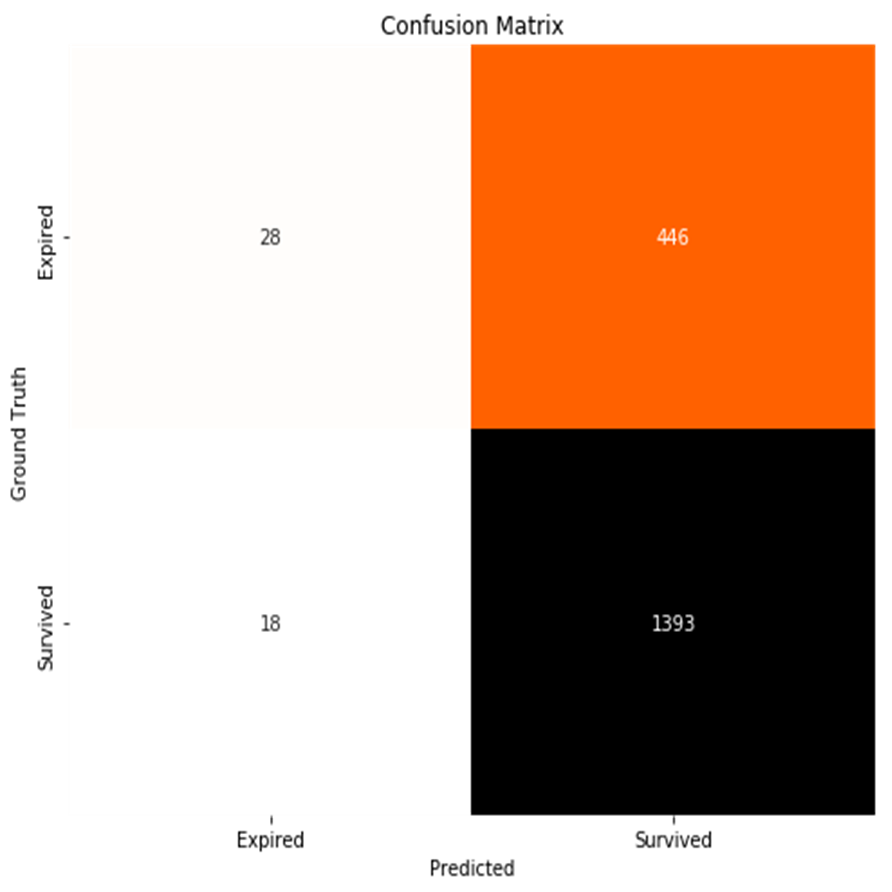
Figure 12. Confusion Matrix of Decision Tree Model
Figure 13 shows the SHAP plot of the Decision Tree model to visualize feature accountability. Each point represents a record in the test set; the red points show that a feature is present while the blue points show that a feature is absent. The gray color indicates ordinal variables that cannot be scaled. Positive SHAP values predict survival, whereas negative SHAP values predict expiration. The distance from x=0 represents the accountability magnitude. As previously seen in the Decision Tree graph, the SHAP figure shows that Medicaid demonstrates subtle accountability in three predictions.

Figure 13. Decision Tree SHAP diagram
Figure 14 shows the Gain and Lift curves of the Decision Tree model. The purpose of these two graphs is to analyze the imbalanced classification problems. The Cumulative Gains Curve indicates that with a 40% sample of the input dataset, the model can find 60% of the total expired patients and 45% of the surviving patients. The Lift Curve shows that compared to using a random classifier, the baseline, our model performs 150% better at predicting expired patients and 115% better at predicting surviving patients.

Figure 14. Lift and Gains Curve for the Decision Tree Model
Conclusion and Next Steps
In conclusion, we found no demographic disparities in survival outcomes nor the predictive value of the initial triage priority. We reached this finding utilizing the decision tree algorithm, which performed optimally amongst the logistic regression, random forest, and SVM. Moreover, socio-economic demographics did not demonstrate significant decision-making factors for survival likelihood. The breakdown of triage priority in terms of demographics reflected the social disparities (for example, low-income patients covered in Medicaid tended to be less healthy at the time of admission, which is supported by Becker and Newsom’s claim that low-income patients seek healthcare less often and usually for an emergency [6]). However, there was no indication of bias or systemic discrimination by the hospital.
On the other hand, the SHAP graph and decision tree nodes concluded that initial triage priority (assessment color) played a dominant role in predicting whether a patient will respond well to medical intervention.
To restate, we identified that the Decision Tree (entropy, three levels, accuracy: 75%, precision: 76%, recall: 99% ) is the optimal model that provided us with these findings.
For future work, the input dataset can be improved, especially in terms of the assessment time points. Inconsistencies in the assessment time point data restricted the validity of ventilator duration. Apart from that, medical researchers can collect more detailed data about the patients using ventilators, such as data on physical readings of a patient at each assessment. In the existing literature, researchers use BMI, blood pressure, and symptoms in the existing literature as other predictive values of COVID survival [4]. Thus, clinical researchers can add data about the preexisting health conditions of the patients.