
Background
- The pandemic has lasted for more than one year, it impacts our lives in various aspects. Among them, the mental health issue is a growing concern across the country. To better understand the situation, we want to study social media like Twitter, more specifically, the tweets that are related to mental health.
Project Vision & Goals
Project Vision
- Understand how the degree of mental health issues changed over time and space.
- Find out what topics are people concerned about.
- Infer what group of people are more likely to have mental health issues.
Project Goals
- Identify tweets mentioning different health conditions (such as mental health, respiratory and cardiovascular) during the COVID-19 pandemic.
- Spatial (different countries or states) and Temporal distribution of tweets with mental health and other health symptoms.
- Perform sentiment analysis (spatial and temporal) and topic modeling (overall and different sentiment groups).
- Demographic estimation of Twitter users who might have mental health or other health conditions during the COVID-19 pandemic.
DATA OVERVIEW
Data Preprocessing – Flow Chart
The following is the flowchart showing how we processed our data.
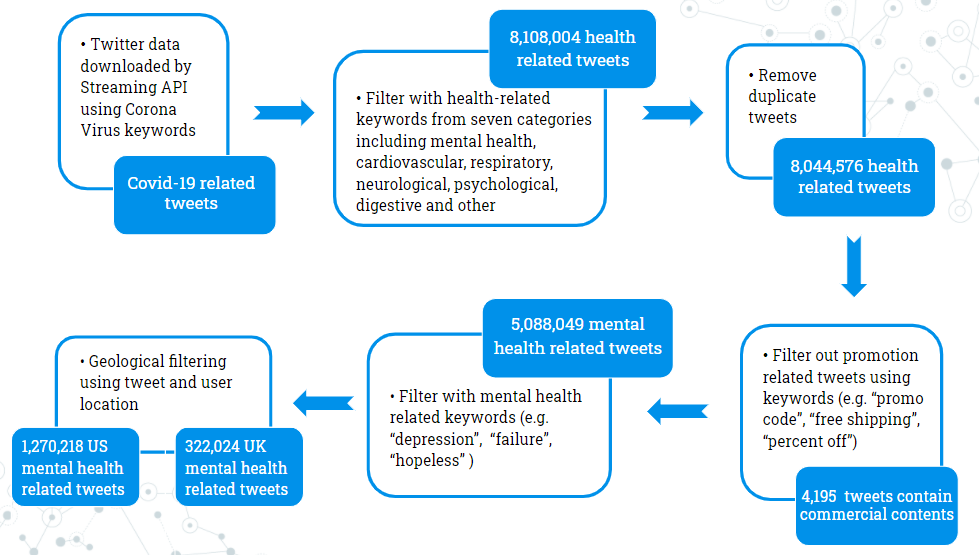
The dataset is provided by our sponsor Prof. Zidian. It was collected using the Tweepy streaming API in a one-year period from Mar 5th,2020 to Feb 1st, 2021. The keywords used are Covid-19 related, abbreviations, and alias.
Our dataset is huge and about 6 terabytes. To extract useful information, we applied the first round of filtering using keywords from seven categories that related to health conditions. During the processing of merging the dataset, around 60,000 duplicate tweets were removed. Also, we have “corona” in our keyword set, so we tried to filter out commercial contents, and about 4,000 tweets were removed.
Our final dataset was built by applying another round of filtering using mental-health-related keywords. Upon that, we applied geological filtering to build our country/state dataset.
Dataset Description
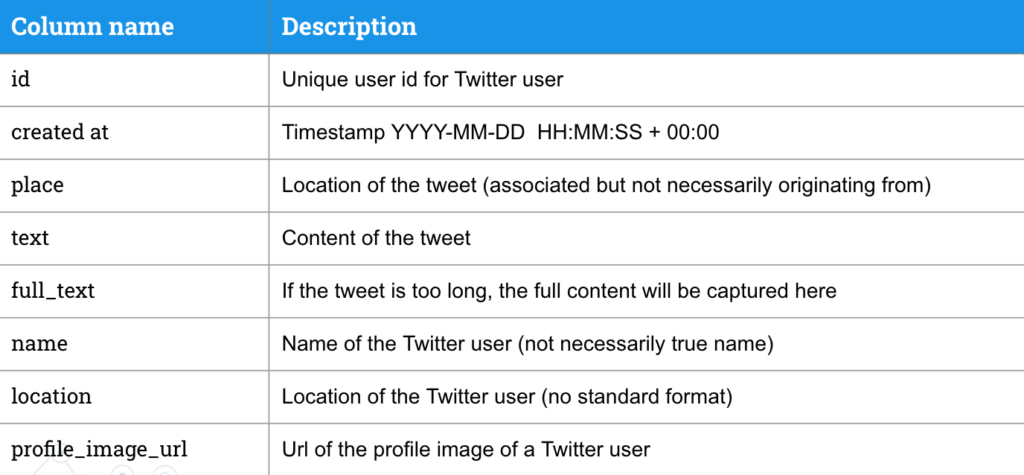
The information collected in the dataset are tweets. Originally, each tweet contains 37 features and some features are dictionaries that contain far more information. For example in “user”: there are “name”, “location”, “follower count”, etc. Among all those features, we select 8 features that we care about and they play important roles in our study.
The following is the first 5 entries in our NY dataset.
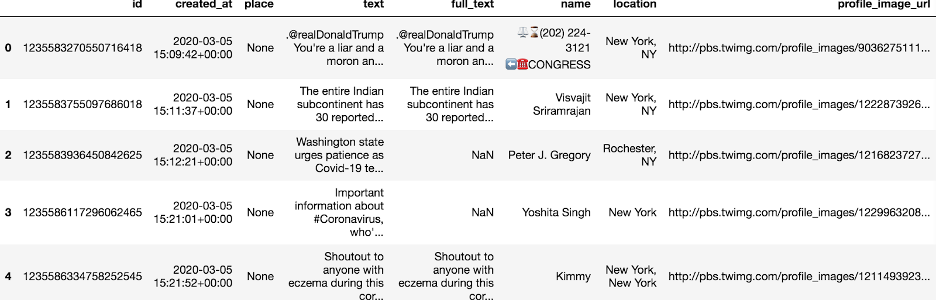
The following is a more detailed description of the features that we selected. Timestamp and location help us carry out geological and temporal filtering. The text plays a big role in sentiment analysis and topic modeling. And Profile image URL and name contribute to our demographic analysis.
ANALYSIS & RESULTS
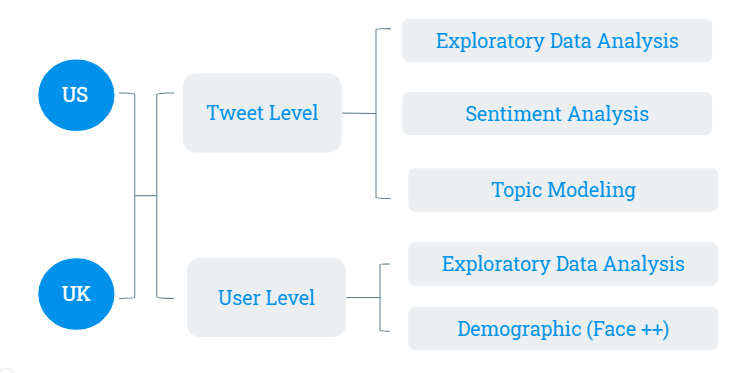
We applied our analysis separately on US and UK datasets, then we also did a comparison between the results from these two datasets. There are two levels of analysis. The first level is tweets level which contains exploratory data analysis (EDA), sentiment analysis and topic modeling. The second level is user level, which contains EDA and demographic analysis.
US – Tweet Level – EDA
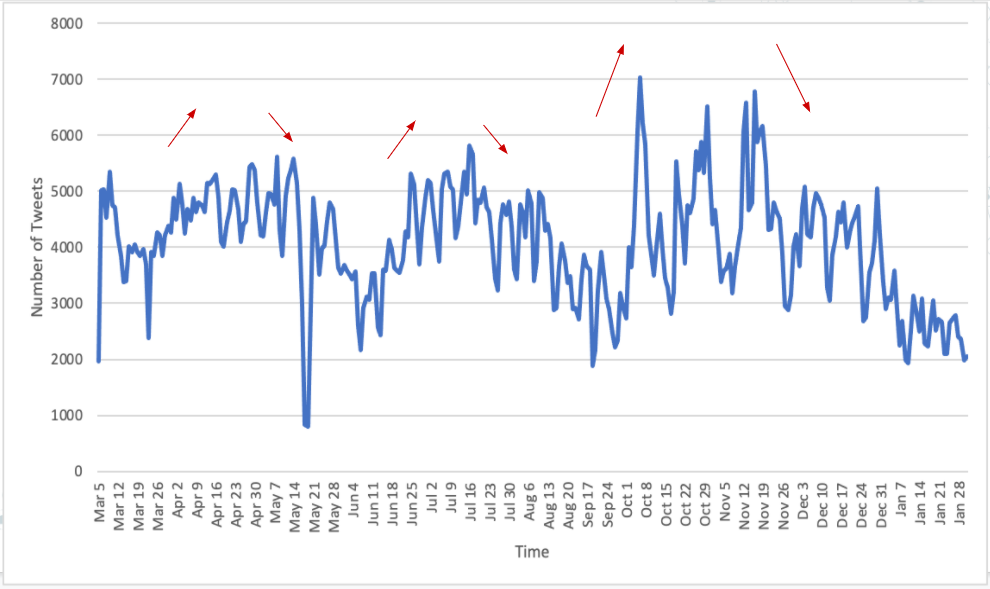
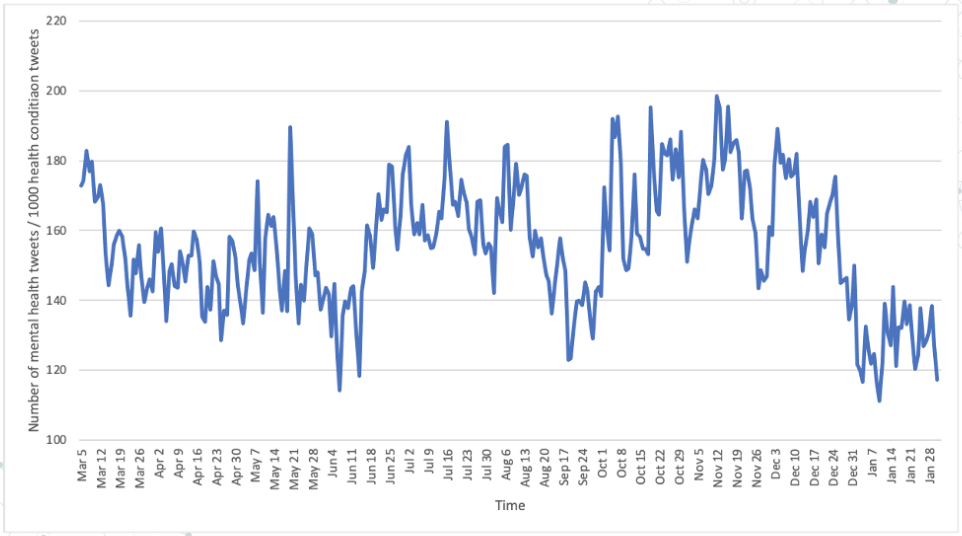
We start with the temporal analysis on number of tweets mentioning mental health over time in US. Figure 5 shows that there are three main periods: March-May, June – September, October – January, and three peaks: late April – early May, middle July, late October – early November. To avoid the bias, we further normalized it by the number of health condition tweets which is shown in figure 6. After the normalization, it still shows a similar trend which may indicate that the fluctuation of the number of tweets is caused by people’s concern of mental health issues during the pandemic period.
US – Tweet Level – Sentiment Analysis
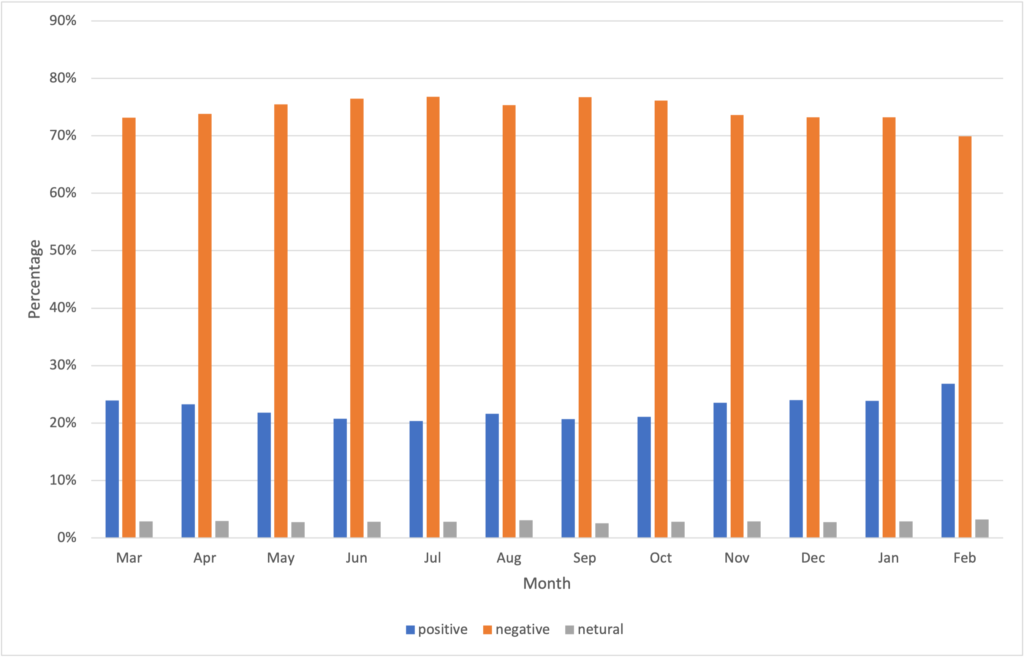
To have a better understanding of people’s perception, we applied Valence Aware Dictionary and sEntiment Reasoner (VADER) which is a sentiment analyzer that calculates a sentiment score for each tweet [1]. Tweets with sentiment scores between -1.00 to -0.05 are classified as negative tweets, tweets with scores between -0.05 to +0.05 (not including -0.05 and 0.05) are classified as neutral tweets, and tweets with scores between +0.05 to +1.00 are classified as positive tweets. Figure 7 shows the distribution of positive, negative and neutral tweets in each month. The graph indicates that most of the tweets are negative, and there is no obvious trend over time. That is reasonable because all the tweets are filtered by the mental health related keywords, and most of them are negative.
US – Tweet Level – Topic Modeling
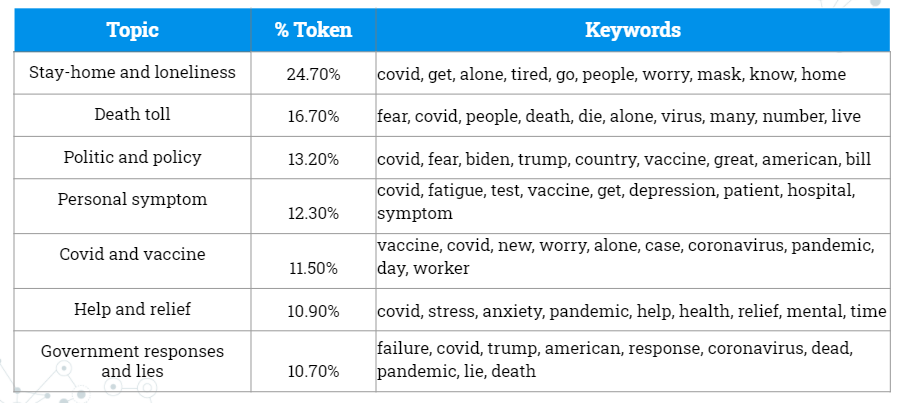
Since the sentiment is negative because of the nature of our keywords, we apply topic modeling to understand we are topics people most care about. The following figure illustrates how topic modeling works and the criteria for determining the number of topics.
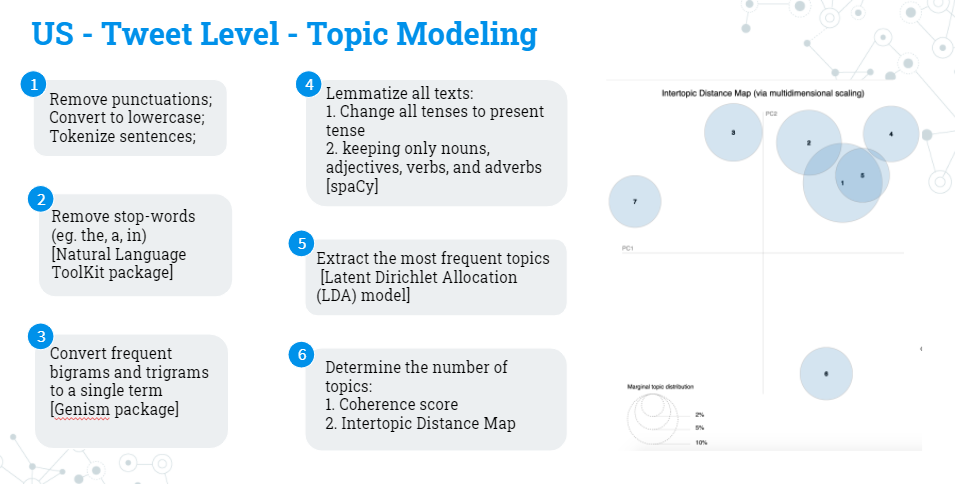
Figure 9 shows the result of the topic modeling. 7 topics have emerged. The first topic is with the highest percentage. We relate it to the loneliness that is caused by stay-home order and quarantine. The following topics have similar percentages. For the second topic, we relate it to anxiety and fear caused by the rising number of deaths. We see people talking about politics and express disappointments in government response and lies in the third and last topic. We see people mentioning personal symptoms like fatigue and depression and people’s discussion of the vaccine in the fourth and fifth topic. For the sixth topic, we believe it’s an indication of people finding help and relief from their mental health conditions. Topic modeling has really given us an understanding of what people are worried about.
US – User Level – EDA
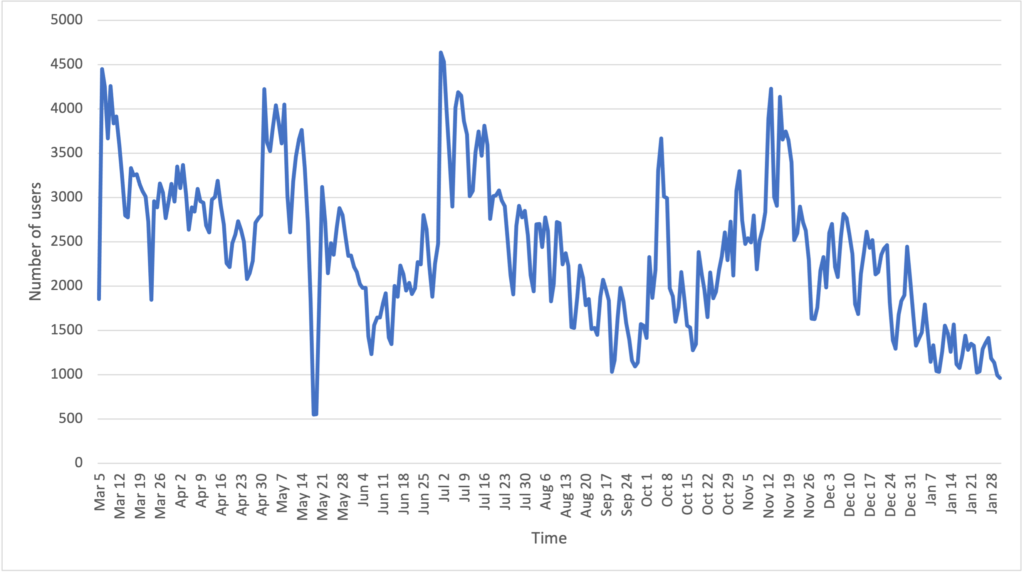
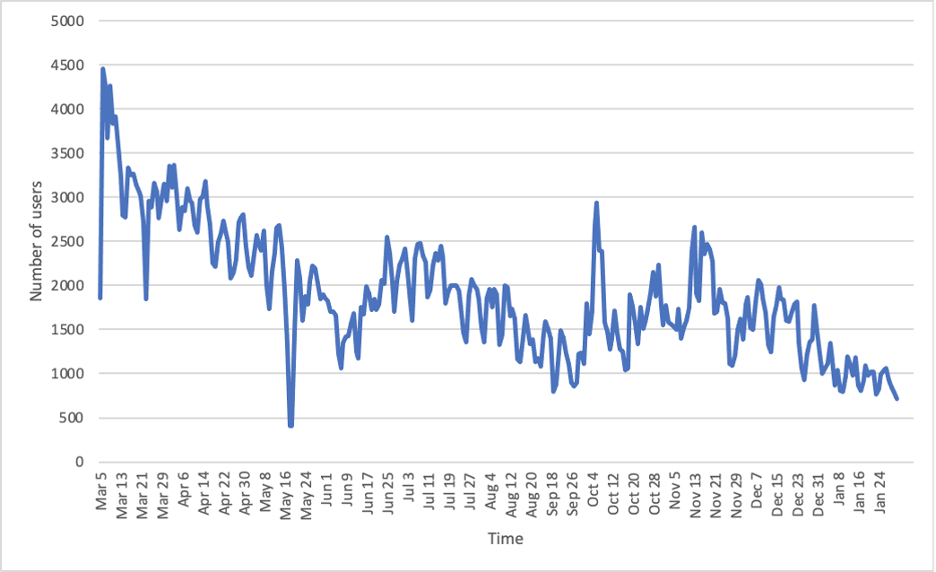
Next , our analysis moves to the user level. We first had figure 10 on the number of users posting mental-health tweets at a daily scale. We then created the graph based on the first tweet of the users (figure 11), which shows a decreasing trend. It might suggest that the peaks are actually bought by repetitive tweet posting of users who have posted about mental health before. This is a very interesting result and we want to further our study by inferring who are the people that are having bigger mental health issues.
US – User Level – Demographic Analysis
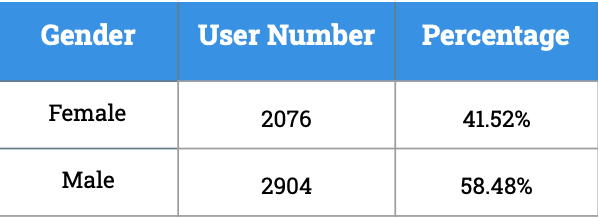
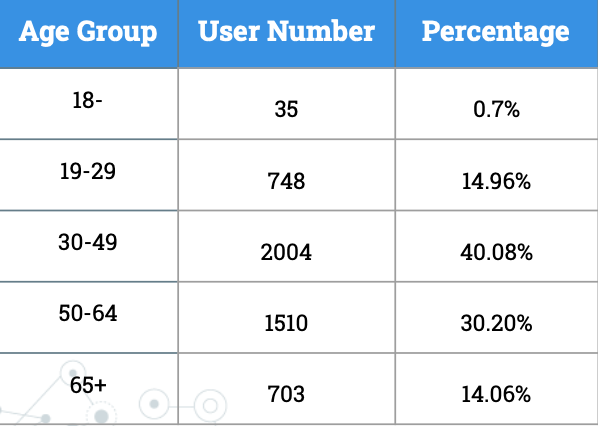
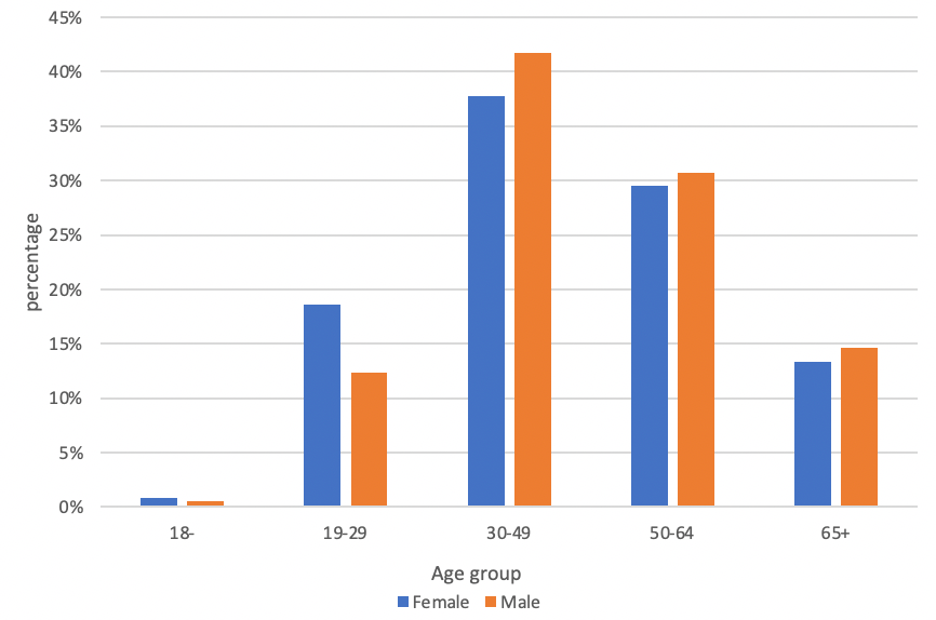
We grouped the users by the tweets they have posted and applied Face++ (an openAI platform) to do a demographic inference [3]. Face++ would detect the number of faces in the profile image and predict age and gender. We obtained the results with only one face which are shown in figure 12. Male has a slightly higher proportion than female, and most users are from the middle-aged and the old group. Figure 12c shows the distribution of gender in each age group. In the young-aged group, there are more females mentioning mental health problems, but in the middle-aged and the old group, the proportion of males is higher.
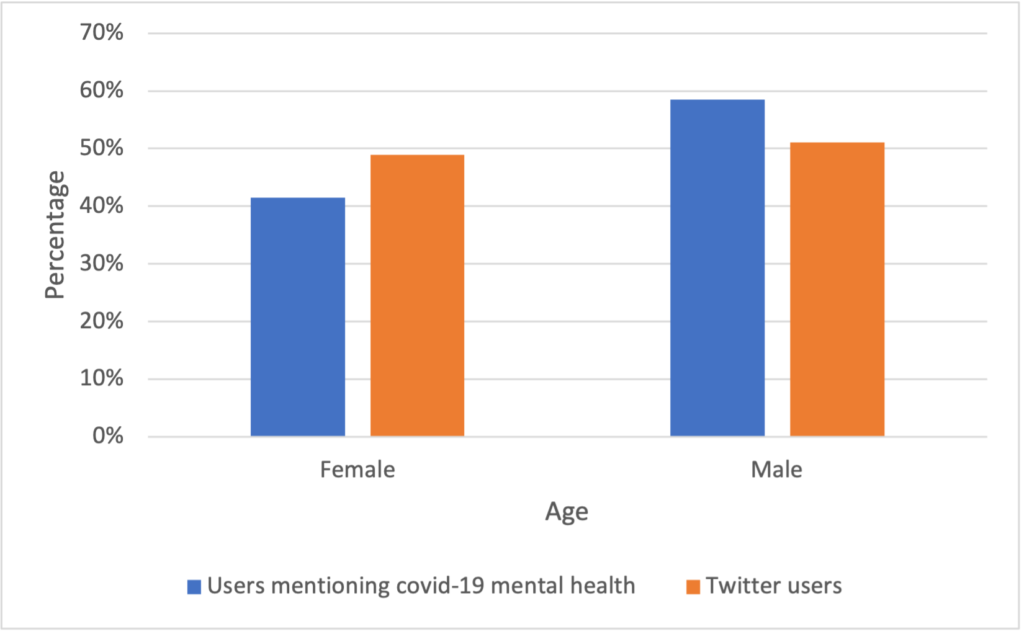
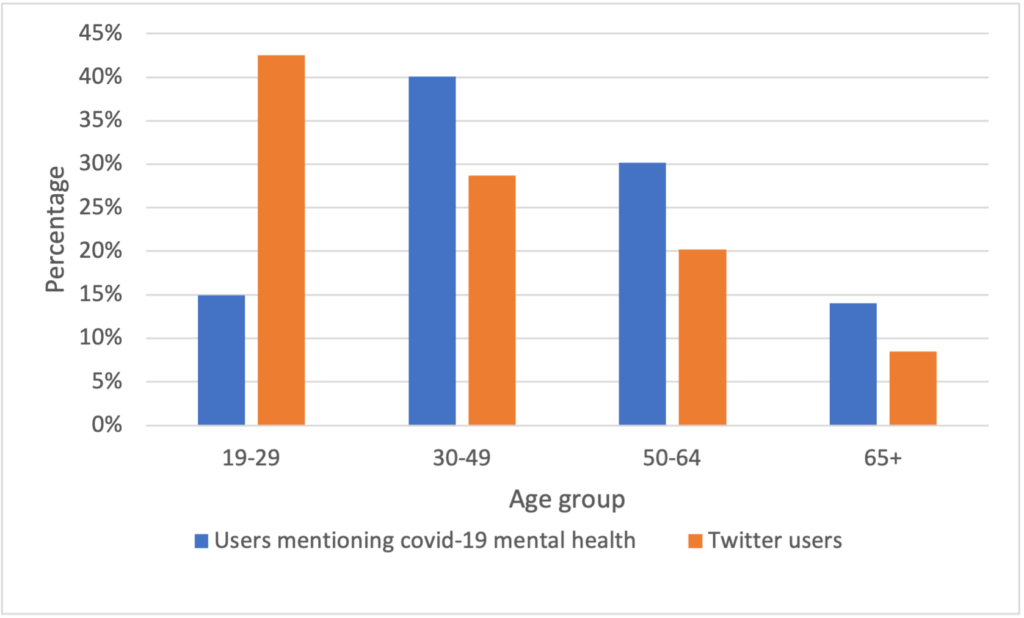
Then, we compared our results to the distribution of general twitter users [4]. Figure 13 shows significant differences between the distribution of covid-19 mental health related users and the distribution of the general twitter users. That might indicate that the differences among each group that we discovered in figure 12 is not completely caused by the preference differences of using Twitter among each group. Some groups of people are more likely to have a mental health problem during the pandemic.
UK – Tweet Level – EDA
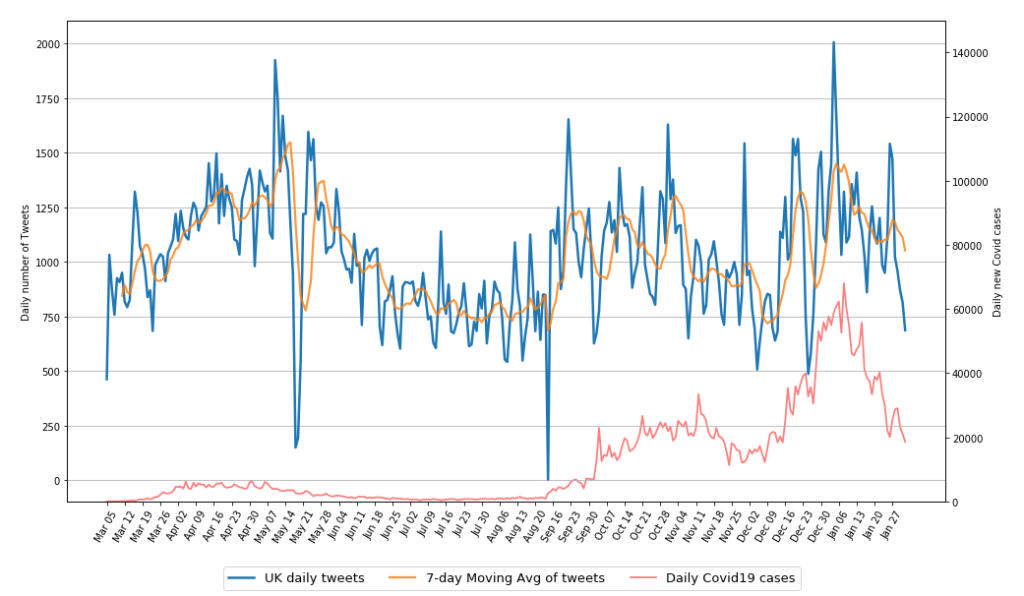
We basically used the United Kingdom data as our comparison set for United States to see how the two English-speaking countries differ by their tweets and users level regarding mental health issues in this pandemic. Figure 14 shows our exploratory analysis of temporal tweets level, which has the daily number of tweets mentioning mental health keywords and the daily new Covid cases in UK plotted in the same graph. As the general three waves of UK’s pandemic (the very first one began at the end of March) all have corresponding peaks of tweets numbers, it can be inferred that our list of mental health keywords does precisely reflect British people’s mental concerns in this pandemic.
UK – User Level – EDA
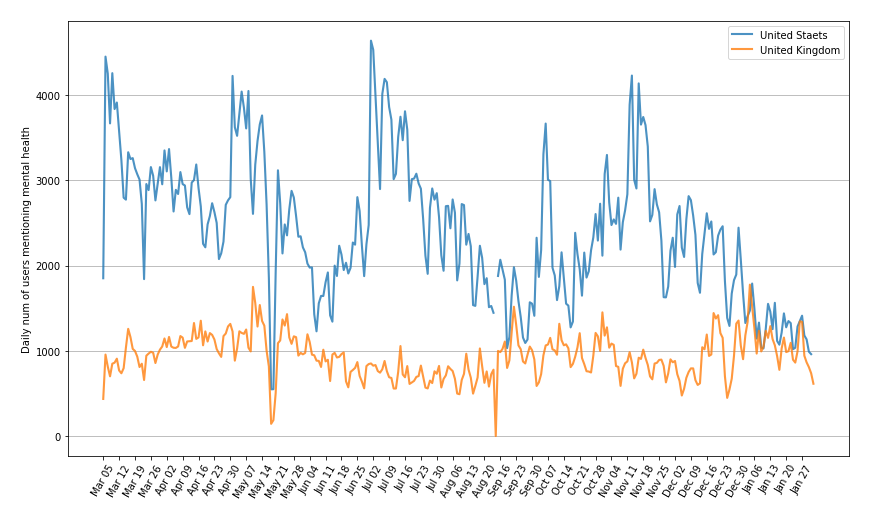
Our temporal analysis of daily number of users mentioning mental-health-related keywords shows a very similar pattern as the daily number of tweets. And besides, the number of users is a more suitable factor to be scaled, normalized, and therefore be compared at different scales. Figure 15 (a) shows the number of users posting mental-health-related tweets at a daily scale for both United States and United Kingdom without any scaling, which gives us a clear impression on their trends and the contrasting user levels.
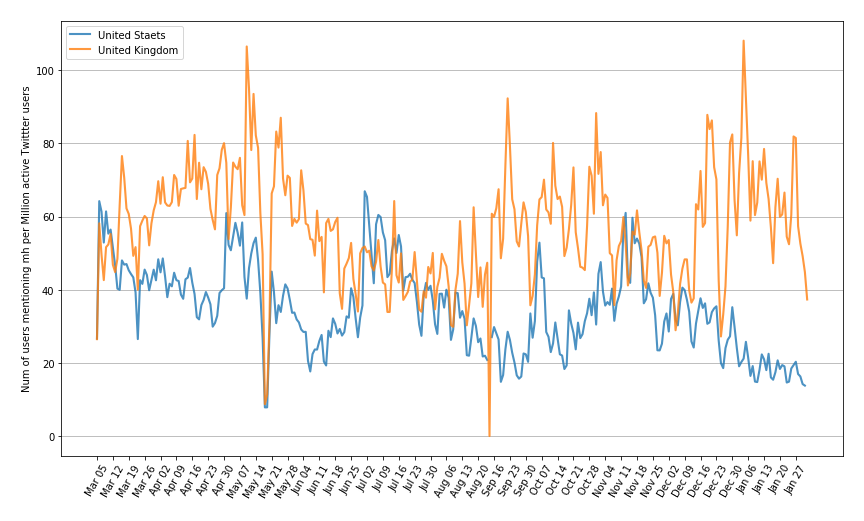
We then scaled the two time series by the recent statistics that United States has 69.3 million active Twitter users and United Kingdom has 16.45 million users as of January 2021. As shown in Figure 15 (b), we therefore estimated the number of users with potential mental health issues per million Twitter users at a daily scale for both countries. Just as our expectation, the scaled number of our targeted users for US and UK stay at the similar level; and the graph also suggests that British Twitter users tend to use the mental-heath-related keywords more to express their concerns during the pandemic.
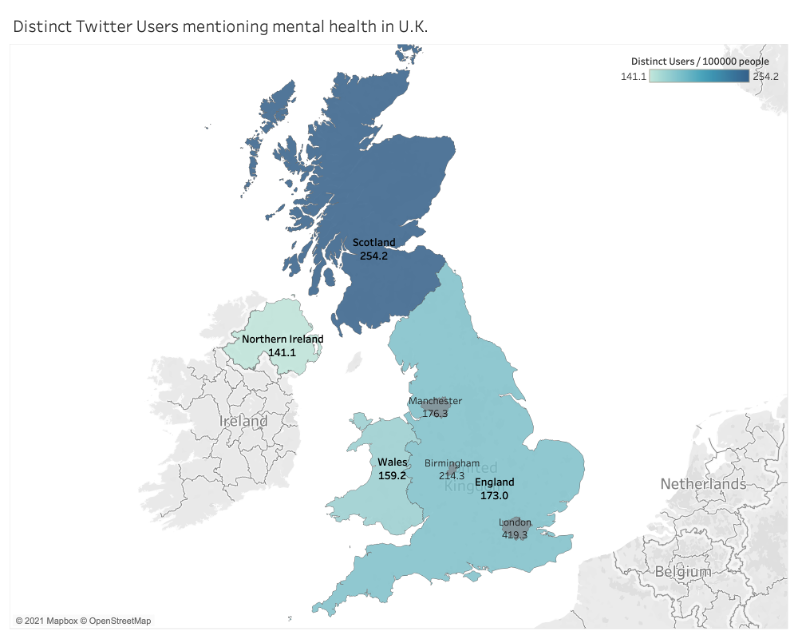
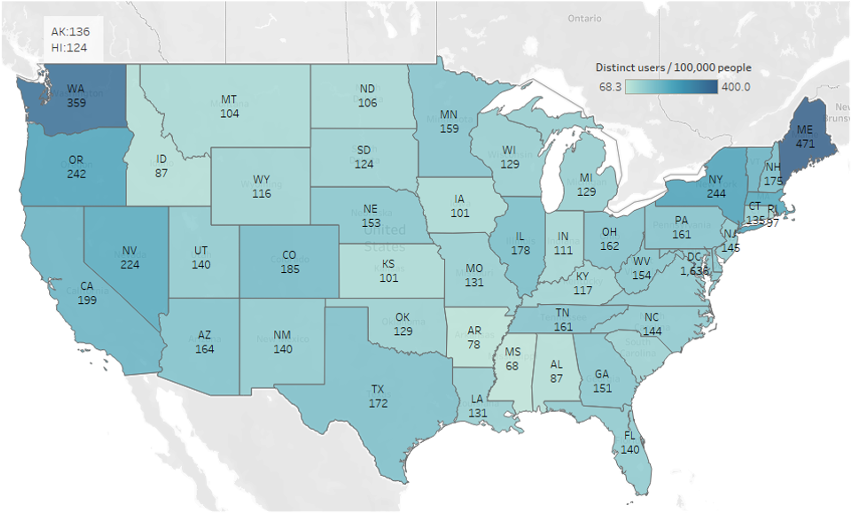
We further estimated the potential Twitter users with mental health issues geographically. In the Figure 16 below, we visualize the number of Twitter users mentioning mental health keywords per 100000 users by state for US, and by country and metropolitan area for UK. For both countries, we can observe a relatively similar level of people expressing their concerns with the keywords on our list for each state of America and the four countries of United Kingdom. On the other hand, there seem more such users in west and east coast, especially the New England, than the central United States; and people in the metropolis like London tend to use the mental-health-related words more commonly than the other area, thus indicating a high prevalence of mental health issues. More interestingly, northernmost regions of both US and UK, including Scotland, Washington and Maine, all exhibit more of our targeted users the others. We expect to look into this pattern to see what factors cause this and how in our future work.
UK – Tweet Level – Topic Modeling
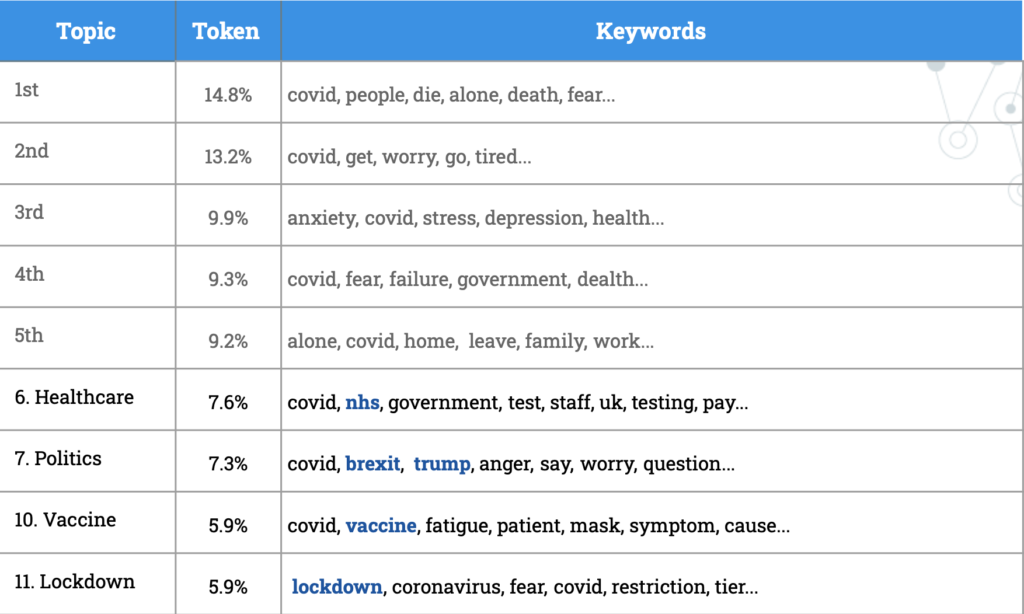
Back to the tweets level, our results of topic modeling for the British tweets’ content (Figure 17) shows that the first five topics are similar to the United States’ results, including the fear of death, or stress and anxiety due to isolation in this pandemic. From the next few topics, we can see some more particular areas British people concern, including their healthcare system (NHS), Brexit and Donald Trump, and the lockdown/restriction imposed by their government.
UK – User Level – Demographic Analysis
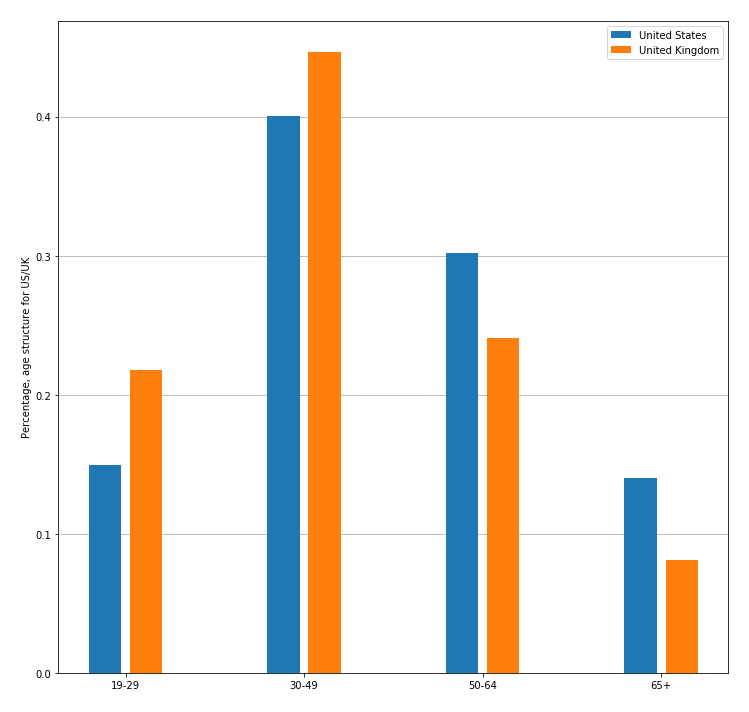
In our last step, we also did a demographic inference with Face++ to see how the distributions of our targeted group, the potential users with mental health issues, differ for the two countries. As shown in Figure 18, the sex ratio of British and American users are almost identical. Regarding the age structure however, the distribution of our targeted users in UK is more skewed to the middle-aged and the young than US.

CONCLUSION & FUTURE WORK
This study represents a large-scale quantitative analysis of public opinions on mental health during the COVID-19 pandemic time frame. Through the lens of social media, we observe that both U.S. and U.K. had a peak of Number of tweets mentioning mental health around early May and November. In the U.S. there was another peak around Mid-June, and U.K. around mid-January 2021. The number of tweets that people first-time expressed their mental health concern shows a decreasing trend in the U.S. With the application of sentiment analysis, not surprisingly we find that in the U.S. there were around 75% negative attitude tweets of all tweets in each month. The differences in tweets are supported by a more finegrained topic analysis. In the retrieved topics of both U.S. and U.K., the main topics are about quarantine and policy, to be specific – death, alone, government. Switching the perspective to user level, there are more tweets from males than females concerning about mental health in both U.S. and U.K. The middle-aged tend to tweet more about mental health conditions especially in the U.K.
For the near future more demographic features will be inferred. Race is among one of them. At this moment we are using Ethnicolr which needs further accuracy validation on current dataset. We would also consider any other API due to the limitations of the analysis around race and ethnicity using inference based on names with the Ethnicolr API. Population density is another demographic feature which can be retrieved from USZipcode API. It will contribute to a better understanding in rural/urban mental health conditions. With the various demographic features we will be able to observe the differences of sentiment, topics, tweet counts in all those features. All those ways of analyzing can be utilized in other health conditions, for instance, Cardiovascular, Respiratory Neurological, and Digestive conditions.
REFERENCE
- Hutto, C.J. and E. Gilbert, VADER: A Parsimonious Rule-based Model for Sentiment Analysis of Social Media Text. 2015.
- Blei, D.M., A.Y. Ng, and M.I. Jordan, Latent dirichlet allocation. Journal of machine Learning research, 2003. 3(Jan): p. 993-1022.
- Face++. AI Open Platform. www.faceplusplus.com (2020).
- Smith, A., and M. Anderson. “Use of different online platforms by demographic groups.” Pew Research Center. http://www. pewinternet. org/2018/03/01/social-media-use-2018-appendix-a-detailed-table. 2018.