Kaleigh Rook
Mentors
Dr. Andrew Berger and Dr. Samantha Romanick
“Everything you make returns to the Earth as either food or poison.”
Abstract
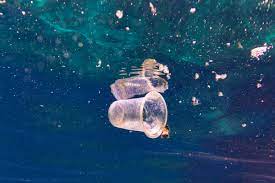
Microplastics have permeated every corner of our environment and it is imperative that a way to remove them be found as their adverse long-term impacts on human health are relatively unknown. Typically 100 μm or less in size, microplastics are in everything. From the bottom of the Mariana Trench to the Arctic ice caps, to being found in our food, water, and air, and inevitably us. Due to this continuing threat, our group is working on identifying and analyzing microplastics in four kinds of environmental samples: ocean water, household dust, atmospheric dust, and biological tissue. If we can determine what kinds of microplastics are in our bodies and our environment, we can take the next steps to determine their origins, quantify them, and ultimately eradicate them.
Why the concern for microplastics?
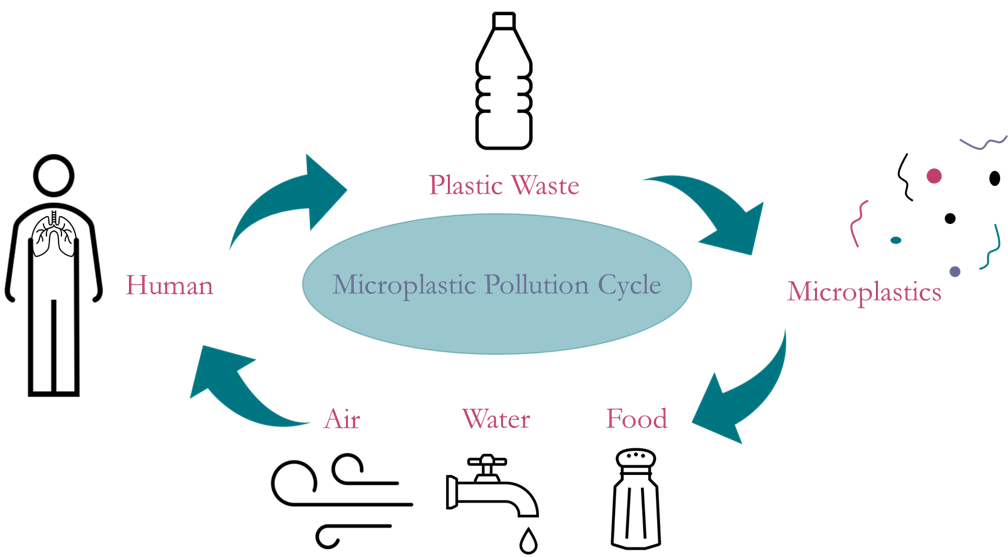
Microplastics are of concern because not much is known about their negative effects on human health. Research on them is continuing everyday, but microplastics are infecting us faster than we can understand them. Humans consume microplastics in almost everything; they are in our food and water, in our dermal products, even in the very air we breathe. These microscopic particles are dangerous to humans because they have the potential to still be doped with the chemicals their larger origin pieces are treated with to make plastic stronger, softer, longer lasting, and many other qualities. These chemicals can then make their way into our lungs and bloodstream, and have the potential to lead to disastrous health risks. Also, given that they are of microscopic size, they smaller they are, the further into our bodies they can penetrate. Because of the potential dangers they pose to humans, there is a growing area of research that is intended to focus on being able to determine different types of microplastics and their specific components. Along with being able to identify a particle as a microplastic in general, it is also beneficial to be able to determine the type of polymer it is. This allows for efficient categorization once a distinction has been made between plastic and non-plastic particles. If we can determine what microplastics are made of, then we are one step closer to being able to determine where they originate from.
Along with my own research on the Pacific Ocean Garbage Patch samples, there are several other projects this research group will continue working on: Raman analysis of microplastics in atmospheric dust, household dust, and biological tissue. With each of the subprojects being conducted by this research group, there are plans to quantify microplastic pollution in a specific location as a result of urbanization, understanding what kinds of particles we bring into our homes, and determining the biogeographical origins of microplastics in an environment.
Methods
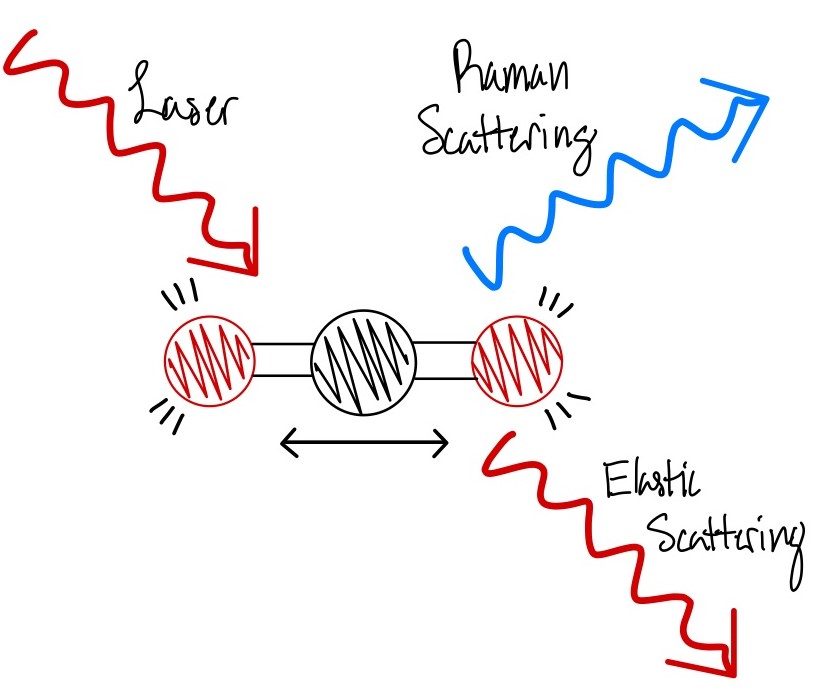
Raman analysis is an ideal method for our lab as it is a noninvasive means of analysis and allows us to reuse our samples later. Raman spectroscopy works by shining a laser light through an objective and affecting the energy levels. The 830nm laser we use in our system causes molecular vibration within the specimen which triggers an energy change and causes elastic scattering and inelastic scattering, which is also known as Raman scattering (4). Within this scattering there is an energy difference between the elastic scattering and the Raman scattering (4). Raman scattered photons have a different frequency and we can then measure that frequency difference as the Raman peaks (4). These peaks act as a kind of fingerprint for any kind of object measured and allows for their identification. Raman analysis paired with confocal microscopy then allows us to shift the focus of the laser from the very top of the specimen plane to inside the specimen, even when the depth of focus is only a few microns. When the laser is focused inside the specimen this allows for a much clearer output of Raman spectra as there is less fluorescence and background noise. The less fluorescence and background noise, the stronger the Raman peaks will be.
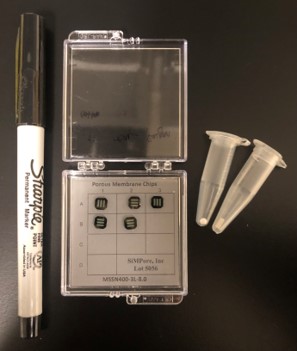
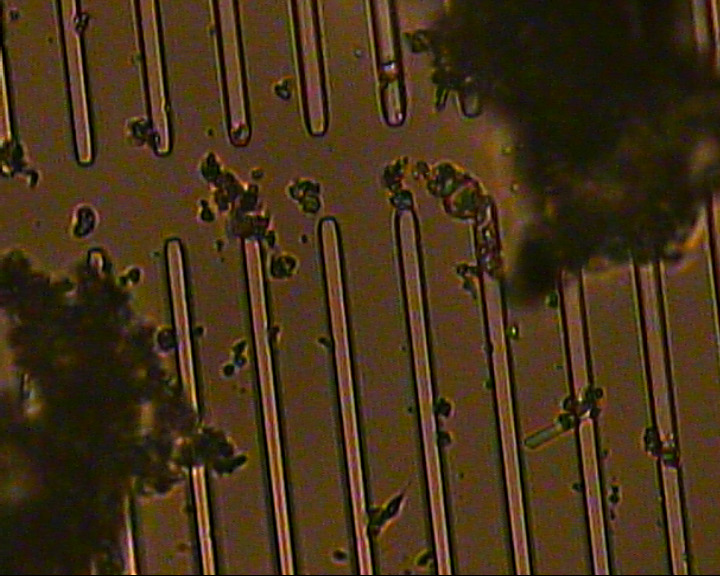
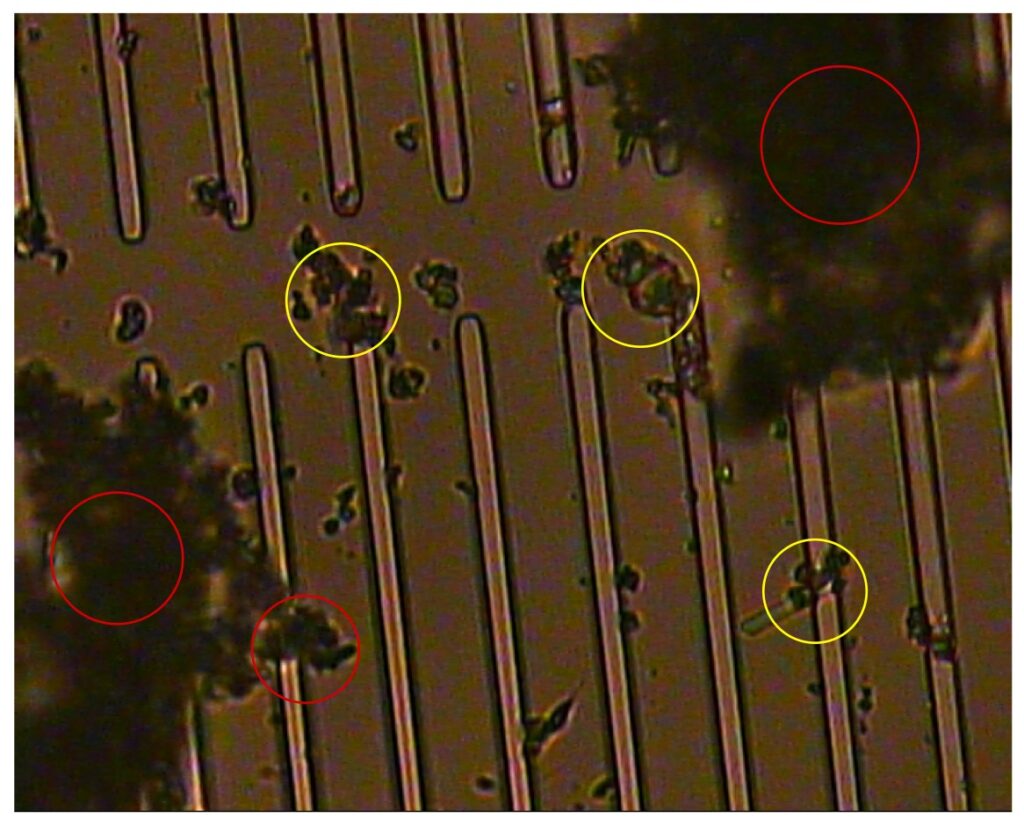
An example of the silicon nitride nanomembranes (from SiMPore), where microplastics are filtered onto, can be seen above. Our group used 1 μm, 8 μm, and 20 μm sized filters to work on identifying particles between 1 to 100 μm in size. After microscopic particles are filtered onto the membranes via water, they are then focused under an 830nm laser in a confocal microscope to look at each individual particle. This laser is what allows us to view the Raman spectrum of any material that may make its way onto a membrane. We first take the full vertical bin (FVB) of the specimen to ensure we have a clear read of the data, and then we take five consecutive images for ten seconds each to be processed. From these processed images we can then extract the Raman spectra of our samples and identify them. To help with the identification process we compared our data with a website called Open Specy and then used our known specimens to create a reference library that can be used to identify unknown samples.
As this project continues to develop, Dr. Romanick will also stain the environmental samples with Nile Red and Trypan Blue dyes. Nile Red stains plastic polymers and Trypan Blue stains cellulosic materials. These will allow for a visual distinction of specimens if other means of identification are not accurate. It also allows for us to select an individual particle for analysis and be confident in the determination of the particle being either cellulosic or plastic.
Reference Library
The first step in being able to identify unknown microplastics in environmental samples was to create our own reference library of known microplastics that we could use to compare to anything found in the environmental samples. To do this we ground down large plastic pellets of each of the larger plastic samples given to us and took their Raman spectra on our system. From these reference samples we have the ability to compare them with any of our data that has gone through our MATLAB analysis process. To use this reference library we have created two different codes to run the post-process information and generate a best match according to the Mean Spectra of each sample. Having two separate codes allows our reference library to have both an automated portion to run multiple data samples at the same time, as well as a manual portion to select individual samples and a reference for a visual best fit on a plot. The automated portion was created by Dr. Berger while I created the manual portion. Our goal is to continue building our reference library as this project continues so that we do not have to access an online source such as Open Specy to identify an unknown, but rather we can rely on our own means of identification.
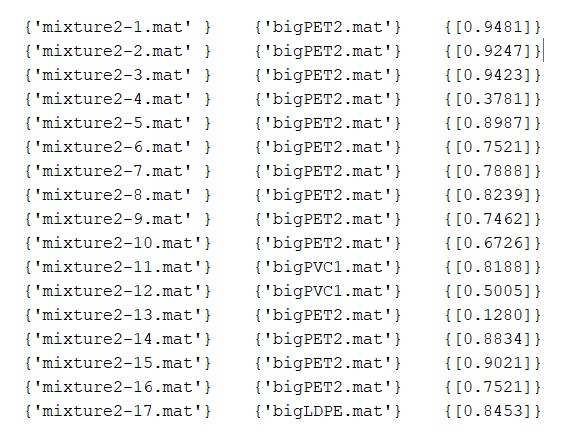
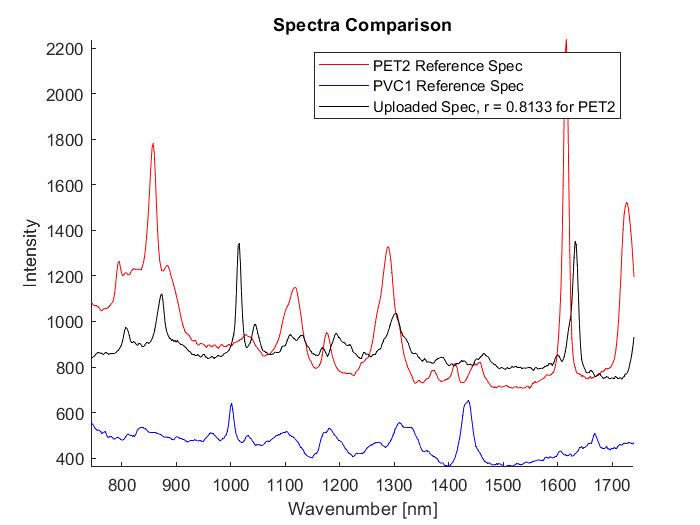
The automated processing of multiple spectra allows for a comparison to the entire reference library while outputting the correlation coefficients for each reference. In the image above on the left, the first column is the name of the uploaded sample, the second column is the name of the reference data that is the best match, and the third column is the correlation coefficient. We are aiming for a correlation coefficient of 0.8 or higher to be considered a viable match. Seen above in both images is data taken from a heterogenous mixture of unknown particles given to me by Dr. Romanick. When we processed this particular sample most of the best fits were to PET2, but two were best fits to PVC1. Several of the measurements also had correlation values below 0.75 which make the matches less trustworthy than those of a higher correlation value. After the automated portion I then selected one of the samples, mixture2-11, and ran it through the manual process. This can be seen in the image on the right above. I also want to note that my correlation coefficient is slightly lower than in the automated portion, but it still provides sufficient data.
Ocean Water Samples
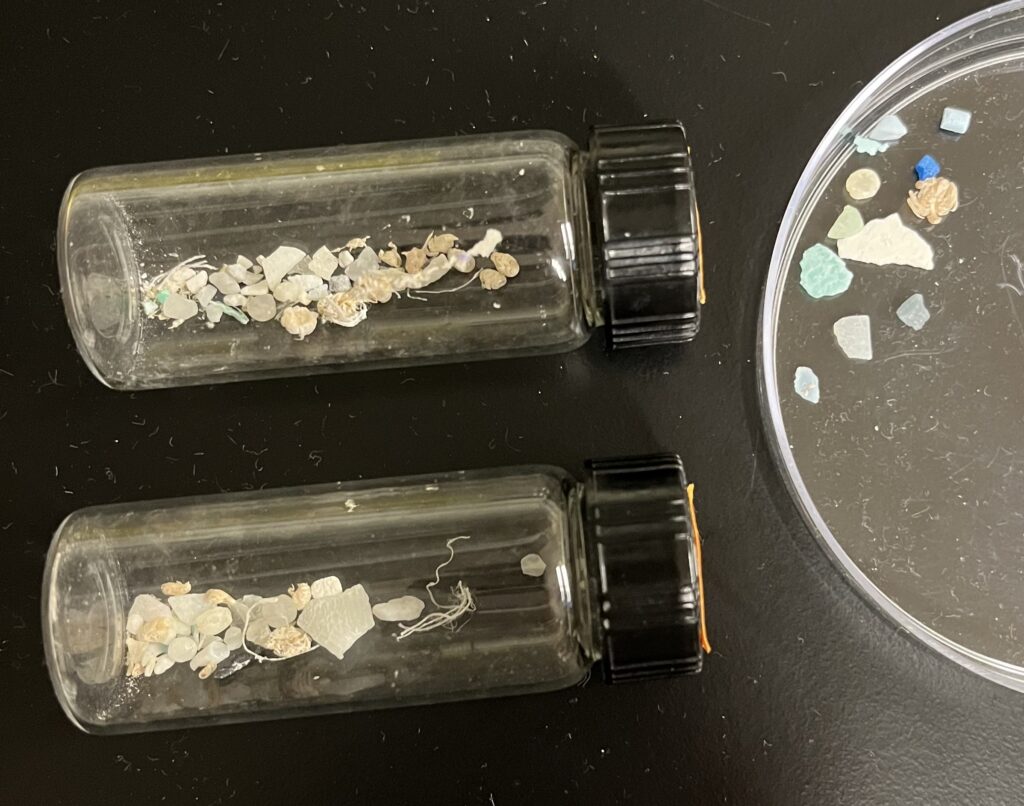
Dr. Romanick received a collection of samples of plastic debris from the Pacific Ocean Garbage Patch as another means of environmental samples. Pictured above, these were collected by a nonprofit called Alguita Marine Research Foundation who focuses on research on the “Great Pacific Garbage Patch” (1). It is important to note that while these are macroscopic specimens and not microscopic plastics, they still can provide vital information for this research project. The Pacific Ocean Garbage Patch is now a shocking 620,000 square miles and shows no signs of decreasing in size any time soon (2). However, because of the size, the garbage patch can also tell us a vast amount of information. With these ocean samples there were two main goals I had in mind: first, I could ensure that I had the ability to identify unknown microplastics in a given environmental sample, and second, that the reference library I created would be of use.
Once I was able to establish the reference library and use it to verify that I could identify unknown particles correctly, I then set out to identify as many of the pieces from the ocean sample as possible. Using the reference library, I was then able to identify both high density and low density polyethylene, polypropylene, polystyrene, and polyethylene terephthalate 2 in the ocean water samples. This is encouraging because we are growing our understanding of what plastics make their way into our oceans. If we can continue to document precisely what kinds of plastics are making their way into the ocean, we can take the next step towards identifying where those plastics are coming from and ultimately how to get them out of our oceans.
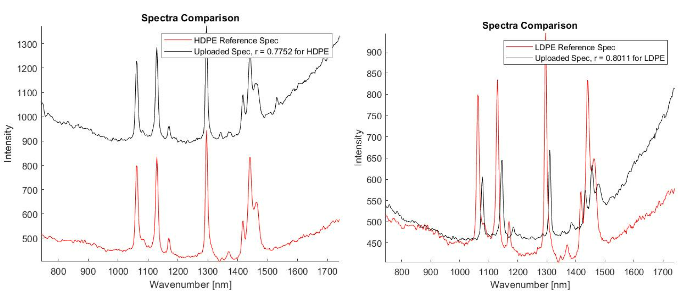
- Left: an unknown ocean sample matching with HDPE (r = 0.7752);
- Right: another unknown ocean sample matching with LDPE (r = 0.8011)
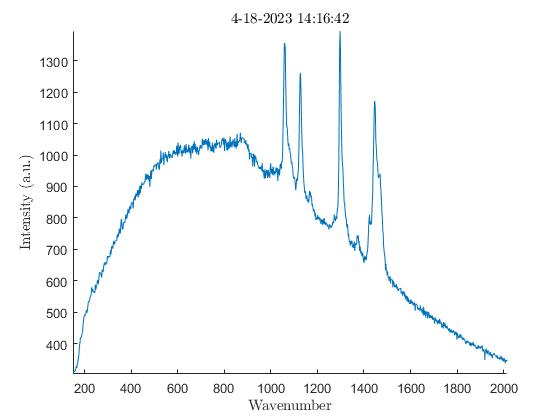
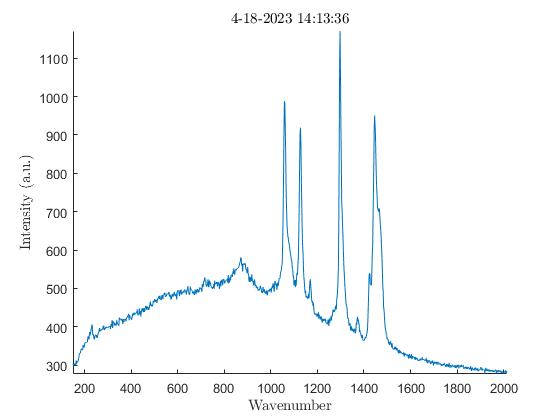
We also noticed the effect oxidation had on the samples. Oxidation, occurring from the elements the samples are exposed to outside, has the ability to weaken the Raman peaks and cause large amounts of background noise (3). To verify this was occurring I analyzed the exterior of a sample first, then analyzed the interior of the same sample after slicing it in half. The output showed a much lower amount of background noise on the interior of the samples with every single one I tested. In the images below there are plots from an HDPE bead exhibiting much higher levels of background noise on the exterior when compared to the interior.
Impact
As this project continues to evolve over the years, our group is hopeful about the positive impact it will have on environmental research and the concern of microplastics. With the ocean samples we can grow our understanding of what kinds of plastics can appear in specific bodies of water and how that may impact the environment around it. Dr. Romanick in particular is hopeful for the impact this entire project will have on the ability to quantify microplastic pollution based on the certain land or population size of an area as the pollution created by human traffic is growing as urbanization does. The biological subproject of this research group, in which the analysis process will be applied to lung, wing, and intestine tissue of bats from Pennsylvania counties, is also being done in tandem with the geography department of University at Buffalo. The hopes for this project are to be able to determine the potential biogeographical origins of microplastic pollution in the environment. This would allow for the identification of potential sources of microplastics that the bats are then consuming and could be more efficient at identifying microplastic pollution as opposed to testing one geographical source at a time. For the household dust samples we want to determine the particles that are present in our homes. These can help us determine potential sources in our homes that microplastics are coming from, and help consumers decide if they want these sources in their homes. Finally, with the atmospheric dust collected from the Black Rock City Desert, our goal is to gain an understanding on microplastic pollution created by human activity during the process of urbanization as well as be able to quantify microplastic exposure in a particular land area or population size. Humans cause pollution, and pollution only negatively impacts us. With these four environmental subprojects combined, we can cover a broad spectrum of our environments and see how microplastics can impact them in different ways.
Conclusion
By using Raman spectroscopy and analysis, I was able to not only identify various kinds of microplastic materials, but I was also able to determine a means of comparing them with unknown samples. Having a reference library to help this group identify materials in a faster method will help continue to drive this project as they analyze the various other environmental samples this research group is in possession of.
Acknowledgements
Special thanks to Dr. Andrew Berger and Dr. Samantha Romanick for supporting me and guiding me through this work. Also, thank you to Dr. Wayne Knox for running this course and allowing such an event to occur.
References
- Moore, C. (n.d.). HISTORY — Captain Charles Moore. Captain Charles Moore. Retrieved from http://www.captain-charles-moore.org/about
- Plastic Oceans Inc. (2022). Pollution Facts | PlasticOceans.org/the-facts. Plastic Oceans International. Retrieved from https://plasticoceans.org/the-facts/
- Petrov, D. V., Matrosov, I. I., & Zaripov, A. R. (2022, July 29). Determination of atmospheric carbon dioxide concentration using Raman spectroscopy. ScienceDirect. Retrieved from https://www.sciencedirect.com/science/article/pii/S0022285217303983
- Yan, D. (n.d.). Guide to Raman Spectroscopy. Bruker. Retrieved from https://www.bruker.com/en/products-and-solutions/infrared-and-raman/raman-spectrometers/what-is-raman-spectroscopy.html