Project Outline
Our Performance Analysis Shoe consists of 5 piezoresistive sensors that alter resistance based on pressure and are connected in series with a known voltage value. We utilize an MCP3008 ADC to sample the analog voltage value at the point between the two resistors and convert it to a digital output stream. This digital output stream is communicated with our Raspberry Pi 5 Model B through SPI communication. This value (0-1023) informs us about the current resistance of the sensors.
Build
In our system we use the individual sensors as the pulldown network and the known resistor as a pull up network. A higher ADC value represents a lower pressure, as that ADC value drops the relative pressure is increasing. We sample the value at 120 Hz and create an organized CSV file. This CSV file is then passed to a MATLAB code file which creates a sliding frame window that allows you to view each individual frame of the user’s gait and playback the frames as a video.
Hardware
The insole is constructed as a layered system designed to reliably measure pressure through changes in resistance while maintaining flexibility and comfort.
At the base is a foam layer shaped like an insole, including an extended “tail” section that routes electrical connections out of the shoe. This foam serves two purposes: it distributes force more evenly across the sensing areas and provides mechanical cushioning for real-world use.
On top of this sits a 3D-printed insole base, which defines the geometry and exact placement of the sensing regions. This base is attached to the foam using a non-conductive adhesive to prevent any unintended electrical pathways. The printed structure ensures consistent alignment of all sensing elements and maintains structural integrity under load.
Copper tape is then applied to the 3D-printed base to form the bottom conductive traces. The tape is oriented so that no exposed adhesive faces upward, minimizing contact resistance and preventing interference with the sensing material. These traces act as one side of the electrical pathway for each sensor.
Piezoresistive elements made from Velostat are placed at predefined sensing locations on top of the bottom traces. These materials exhibit a change in resistance when pressure is applied, forming the core sensing mechanism of the system.
A layer of electrical tape is applied over the base and surrounding conductive regions to electrically isolate the traces and prevent short circuits. While not a perfect dielectric, it functions effectively as an insulating barrier in this low-voltage setup.
Above this, a second foam layer is added. Copper tape is adhered to this layer in a way that ensures the adhesive does not contact the Velostat sensors. This layer forms the top conductive traces (common line), completing the sensing circuit when pressure compresses the piezoresistive material between the top and bottom conductors.
Finally, at the tail section, wires are soldered to the exposed copper traces to provide a stable electrical interface to the Raspberry Pi 4. This allows resistance changes at each sensing node to be measured and processed digitally.
This layered approach ensures consistent sensor contact, minimizes electrical noise from poor connections, and maintains durability under repeated loading conditions.

Software
The MATLAB code searches the CSV file for either 5 or 10 sensors. If there are only 5 the code knows that only one insole is connected and duplicates the values for the second insole to plot both visuals. The code logic is high ADC value means low pressure and vice versa, this is because the sensors are used as the pulldown network and the logic can be flipped if the sensors are used as a pull up network. A 2% filter is implemented, if all of the sensors values are within 2% of the previous frame, the frame is deleted. This is to allow us to sample a little more frequently and not overwhelm the frame data. The code then creates a dense grid of points to estimate pressure between each of the known sensors. In our frame we use a 340 x 500 pressure image.
The code also develops a trace of the insole mask in order to determine which points are within the insole and which are outside. Then for each frame the code creates a smooth pressure estimate by using inverse distance weighting. The closer each point is to a sensor, the more that value influences the pressure at that particular point. We then sum the total contributions to determine the pressure at each point and display it frame by frame. A center of pressure is then calculated by using a weighted average in the x and a weighted average in the y, if the pressure flows mostly towards the heels the COP will move downwards. This would allow us to see influence from right and left as well, but when the code is ran as 5 sensors, it will always be along the center line because the pressure maps are duplicated on both insoles. Heel to Toe/Balance are also calculated using this values and will be displayed, Balance is very similar to moving the center of pressure left and right, and heel to toe is very similar to moving the center of pressure up and down but it isolates it for easier analysis! The code then displays the figure with labels and a color gradient for the pressure map for the user to analyze their gait.
Difficulties/Setbacks
The main setbacks came with a lack of understanding of the importance of each intricate piece of this puzzle. Initially, we had an issue with the type of copper tape we used, as the adhesive completely halted the conductive processes. In our first iteration of the prototype, we were unable to maintain a constant resistance reading from the insole; this was due to the electrical tape not being placed flat without air bubbles or pockets. Some other issues were that the sensor wasn’t getting the correct reading, and there was only a response when the pressure was directly on the overlap of copper tape on the two layers. The solution to this was flipping the top layer of copper tape, as this allowed for the conducting side of the copper tape to be fully utilized. The best solution was to add more and more layers to level out the resistive load. The setbacks that came on the hardware end made it difficult to work on the visualization software.
Future Work
While this project was a good starting point, with adequate materials and more time the goal would have been to dive much deeper and create a more complete standalone product. The difficulties outlined in the section above made it very difficult for us to create a cohesive build and we had to alter our expectations a few times. For starters, creating two well functioning insoles was in our goals but after many iterations we only had 1 consistently functioning products. Our system and software was designed with both insoles in mind but the implementation could not fully be tested due to our hardware limitations. We have some data from in lab testing that utilized two insoles but transitioning this to a more completed product was extremely difficult. The current visualization software could also have been much improved as while the frame analysis works well for short testing and lab work, having someone walk for 5 seconds created around 600 frames! Well too much for someone to scan and scroll through to come to a main conclusion. Finally, one added part we hoped to add was true analysis! The goal was to have some athletes or people recovering from injuries test our product and provide them with some feedback on their gait or balance! Future work would involve using this in an athletic environment to help with performance, a physical therapy rehab center to ensure proper gait while recovering from lower extremity injuries, or testing on anyone who may struggle with balance to provide insight into their balance issues. This project could be used and implemented in many ways but we sadly came up short on time and had to settle for just our completed product.
Related Imagery
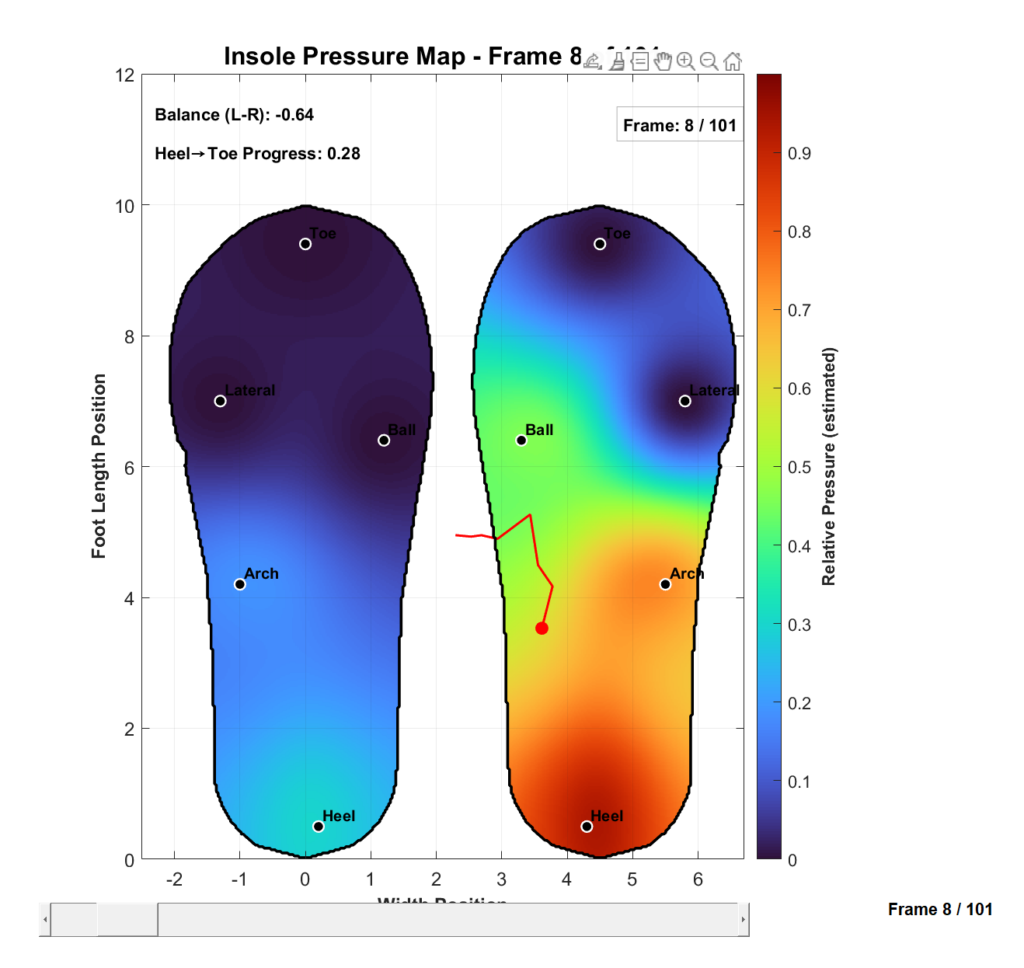
Shown above is an example of a frame of our data, the colors correspond to a relative pressure and the warmer the colors are the higher the pressure. Here we can see a frame likely corresponding to the right heel strike of a user’s gait.
Conclusions
This project successfully demonstrated the design and implementation of a wireless pressure-sensing insole capable of capturing plantar pressure distributions and transmitting data for remote gait analysis. By integrating Velostat-based pressure sensors, embedded data acquisition hardware, and a wireless communication pipeline, the system was able to generate meaningful pressure heatmaps that visualize gait phases such as heel strike and toe-off. The final prototype validated that a low-cost wearable platform can provide quantitative gait analysis outside of specialized laboratory environments.
The project also demonstrated successful integration of both hardware and software systems. Through multiple iterations of the insole design, reliable sensor performance and improved pressure distribution were achieved. On the software side, the Raspberry Pi-based acquisition system, combined with wireless transfer through WiFi and cloud relay, enabled end-to-end communication between the embedded device and the analysis workstation. Experimental testing across multiple wireless networks further showed how network quality directly impacts transfer time and reliability.