Portfolio risk analysis & daily reporting.
This portfolio risk analysis project was completed as a University of Rochester Data Science Capstone for Senior Design Day, with sponsorship from FinchAI.
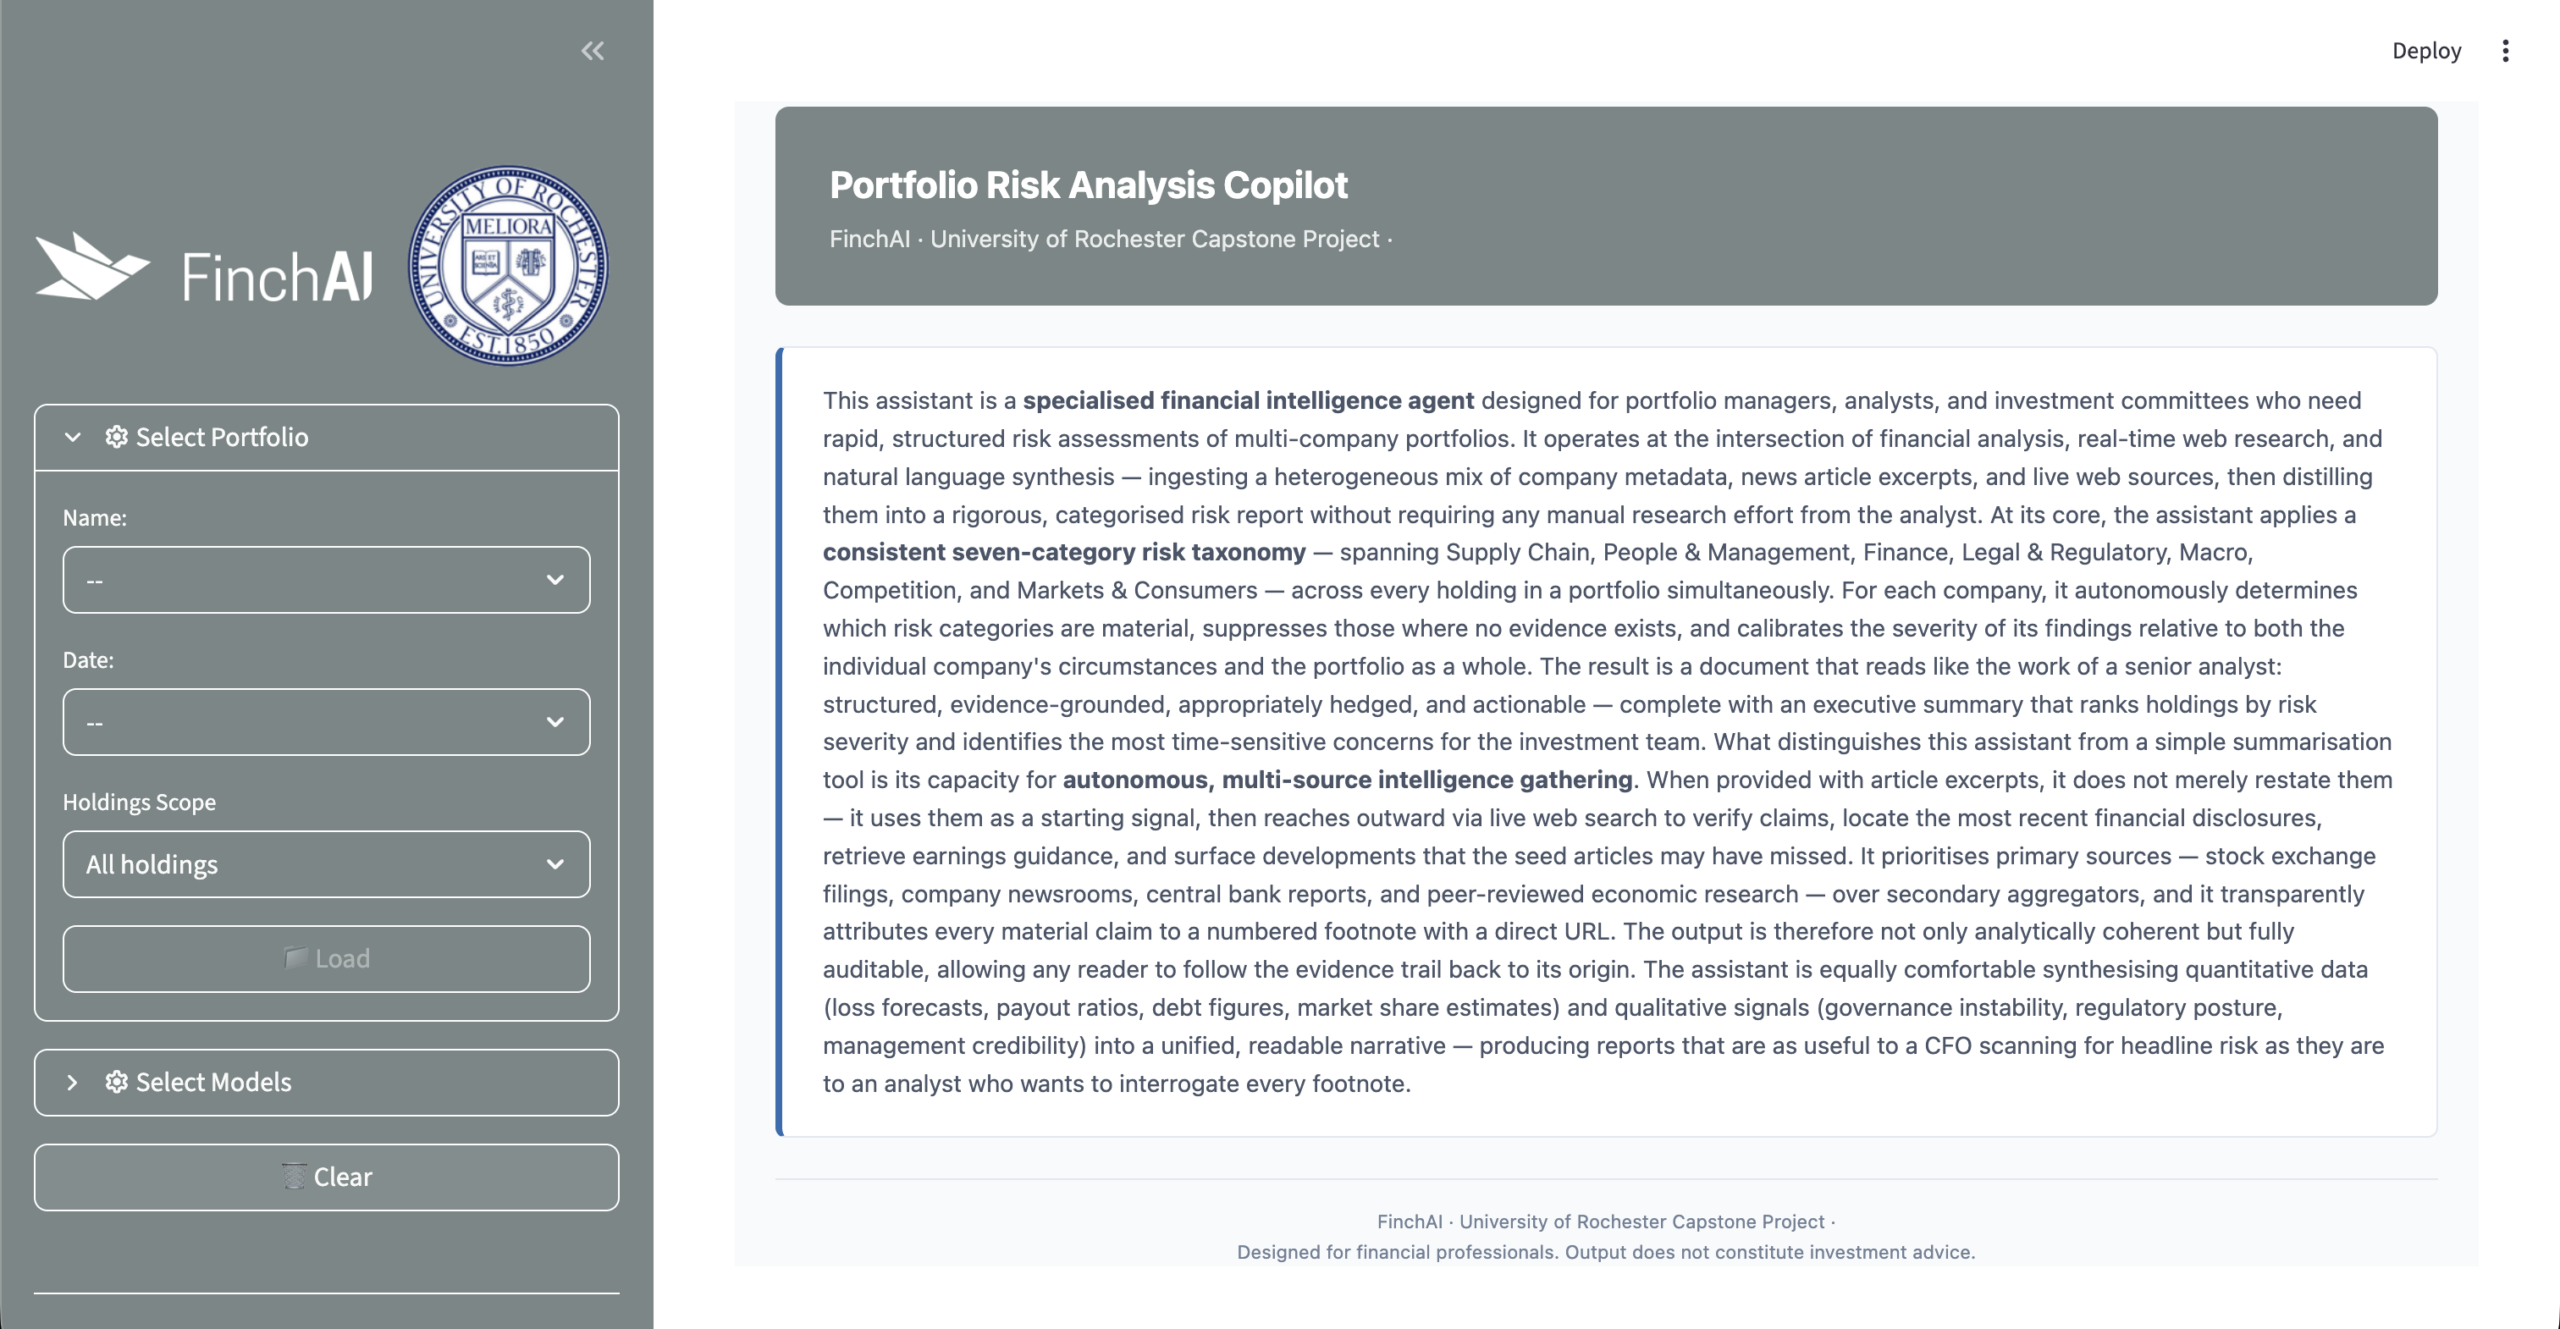
We built an AI-powered portfolio risk analysis copilot that ingests daily company news and identifies material risks across a portfolio. It turns scattered news events into a structured daily report that a portfolio manager can review in under 10 minutes. The system uses LangGraph and Claude to classify risks, aggregate evidence, and generate recommendations.
The Problem with Manual Portfolio Risk Analysis
Portfolio managers tracking dozens of companies face a difficult daily task: reading enough news to identify which holdings face new material risks. Relevant signals are often buried across hundreds of articles, many of which mention a company only in passing.
Manual review is slow, inconsistent, and impossible to scale. Existing tools either require deep human judgment on every article or miss the nuance needed to separate material risk from noise.
Dataset Snapshot
FinchAI daily sentiment-event feeds power the portfolio risk analysis system. For production-style reporting, we used the APAC-LATAM portfolio snapshot: 10 daily CSV files from January 31 to February 9, 2026, with 3,620 article-entity rows across 169 unique entities. Each record includes document metadata, company information, business topics, sentiment, salience, and optional stock identifiers. This structure lets the system connect articles to companies, classify risk signals, and generate a portfolio-level report.
Event Feed
Each article includes a title, source, URL, entity label, business topics, sentiment class, sentiment score, salience score, and entity summary. These fields let the pipeline classify risk signals without scraping raw article text.
Development Data
A larger consolidated dataset of 5,683 observations across 17 columns supported broader development and error analysis, while the portfolio snapshots preserved the daily reporting format expected in production.
Real-World Gaps
The feed is realistic and incomplete. About 52% of rows are missing stock identifiers such as ticker, exchange, or MIC code. We kept these rows because the core analysis works at the entity and news-event level, not only at the ticker level.
Pipeline Workflow
To solve this problem, we built an orchestrator–worker pipeline in LangGraph. The workflow processes each day’s events through five stages.
LLMs handle classification and narrative synthesis. Deterministic Python logic handles severity scoring, category counts, aggregation, and source attribution. This separation makes the system easier to audit and reproduce.
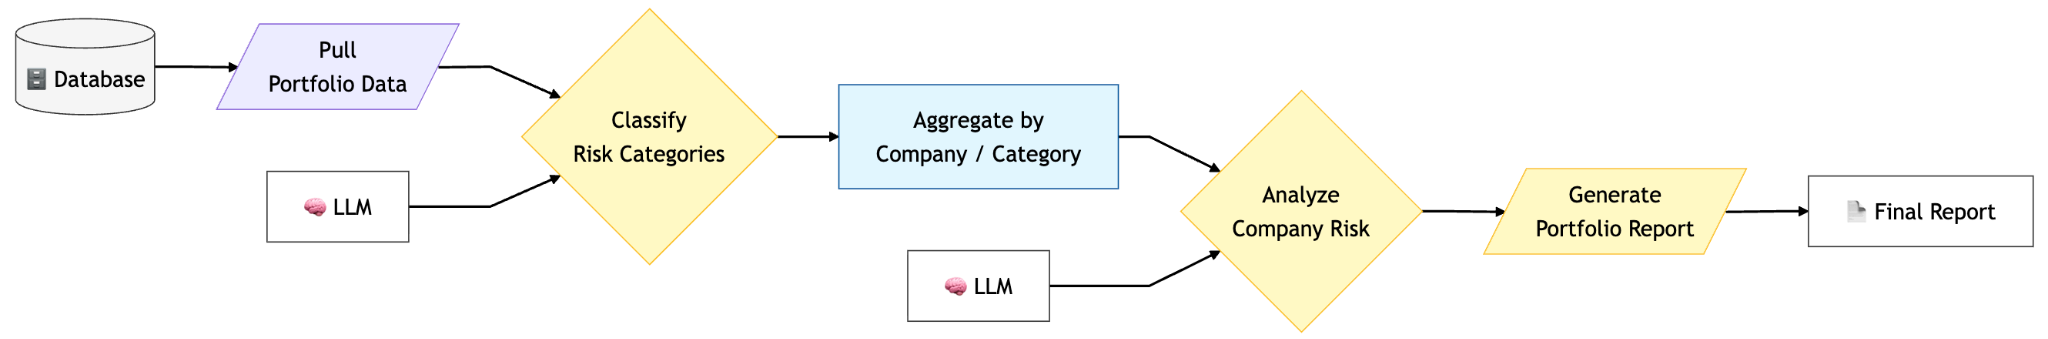
01 — Pull
First, the system loads a named portfolio for a selected date from the FinchAI daily sentiment-event feed. The feed includes company metadata, news events, sentiment scores, salience scores, and business topic tags.
02 — Classify
Next, the system fans out across holdings with LangGraph’s Send API. For each holding, it formats event excerpts as TITLE, TOPICS, and CONTENT. It then asks the model to classify risks using a seven-category rubric.
03 — Aggregate
Then, deterministic logic merges classification results and groups evidence by company and risk category. The system computes severity by category count: HIGH for two or more flagged categories, MEDIUM for one, and NONE for zero.
04 — Analyze
After aggregation, an LLM synthesizes the portfolio-level risk picture. It generates an executive summary, per-company key concerns, confidence scores, and recommended actions.
05 — Generate
Finally, the system renders a structured HTML report. The report includes company-level risk highlights, severity badges, evidence sentences with source attribution, and a portfolio-wide rollup.
Risk Taxonomy
Every flagged event is classified into one or more of seven business-risk categories. The taxonomy is adapted from the Modeling and Detecting Company Risks from News framework, which was designed to organize company news into risk categories that are meaningful for financial analysis. We chose this taxonomy because it is broad enough to cover common portfolio risks, but small enough to support consistent annotation, classification, and reporting.
Supply Chain & Product
Threats to a company’s ability to make, source, or deliver its products and services.
People & Management
Leadership departures, workforce instability, and internal human capital risk.
Finance
Financial health, liquidity, access to capital, and earnings risk.
Legal & Regulatory
Lawsuits, regulatory actions, or policy changes that could materially harm the company.
Macro
Broad external forces beyond company control, including inflation, geopolitics, pandemics, and financial crises.
Competition
Heightened pressure from rivals or disruptive new entrants to the market.
Markets & Consumers
Revenue threats from weakening demand or shifts in customer behavior.
What We Built: Project Deliverables
The final project delivered an end-to-end portfolio risk reporting system with three main components:
- A LangGraph pipeline that ingests FinchAI event feeds, classifies risks, aggregates evidence, and generates a daily HTML report
- A Streamlit frontend with Analyst, Researcher, and Reporter views for portfolio exploration and report generation
- An evaluation framework for measuring category accuracy, evidence faithfulness, and report grounding
User Interfaces
The system is accessible through a Streamlit frontend with four views: an Introduction page and three working interfaces for analysis, research, and report generation. Each view is scoped to the holdings a manager selects, so every query and report reflects the companies under review.
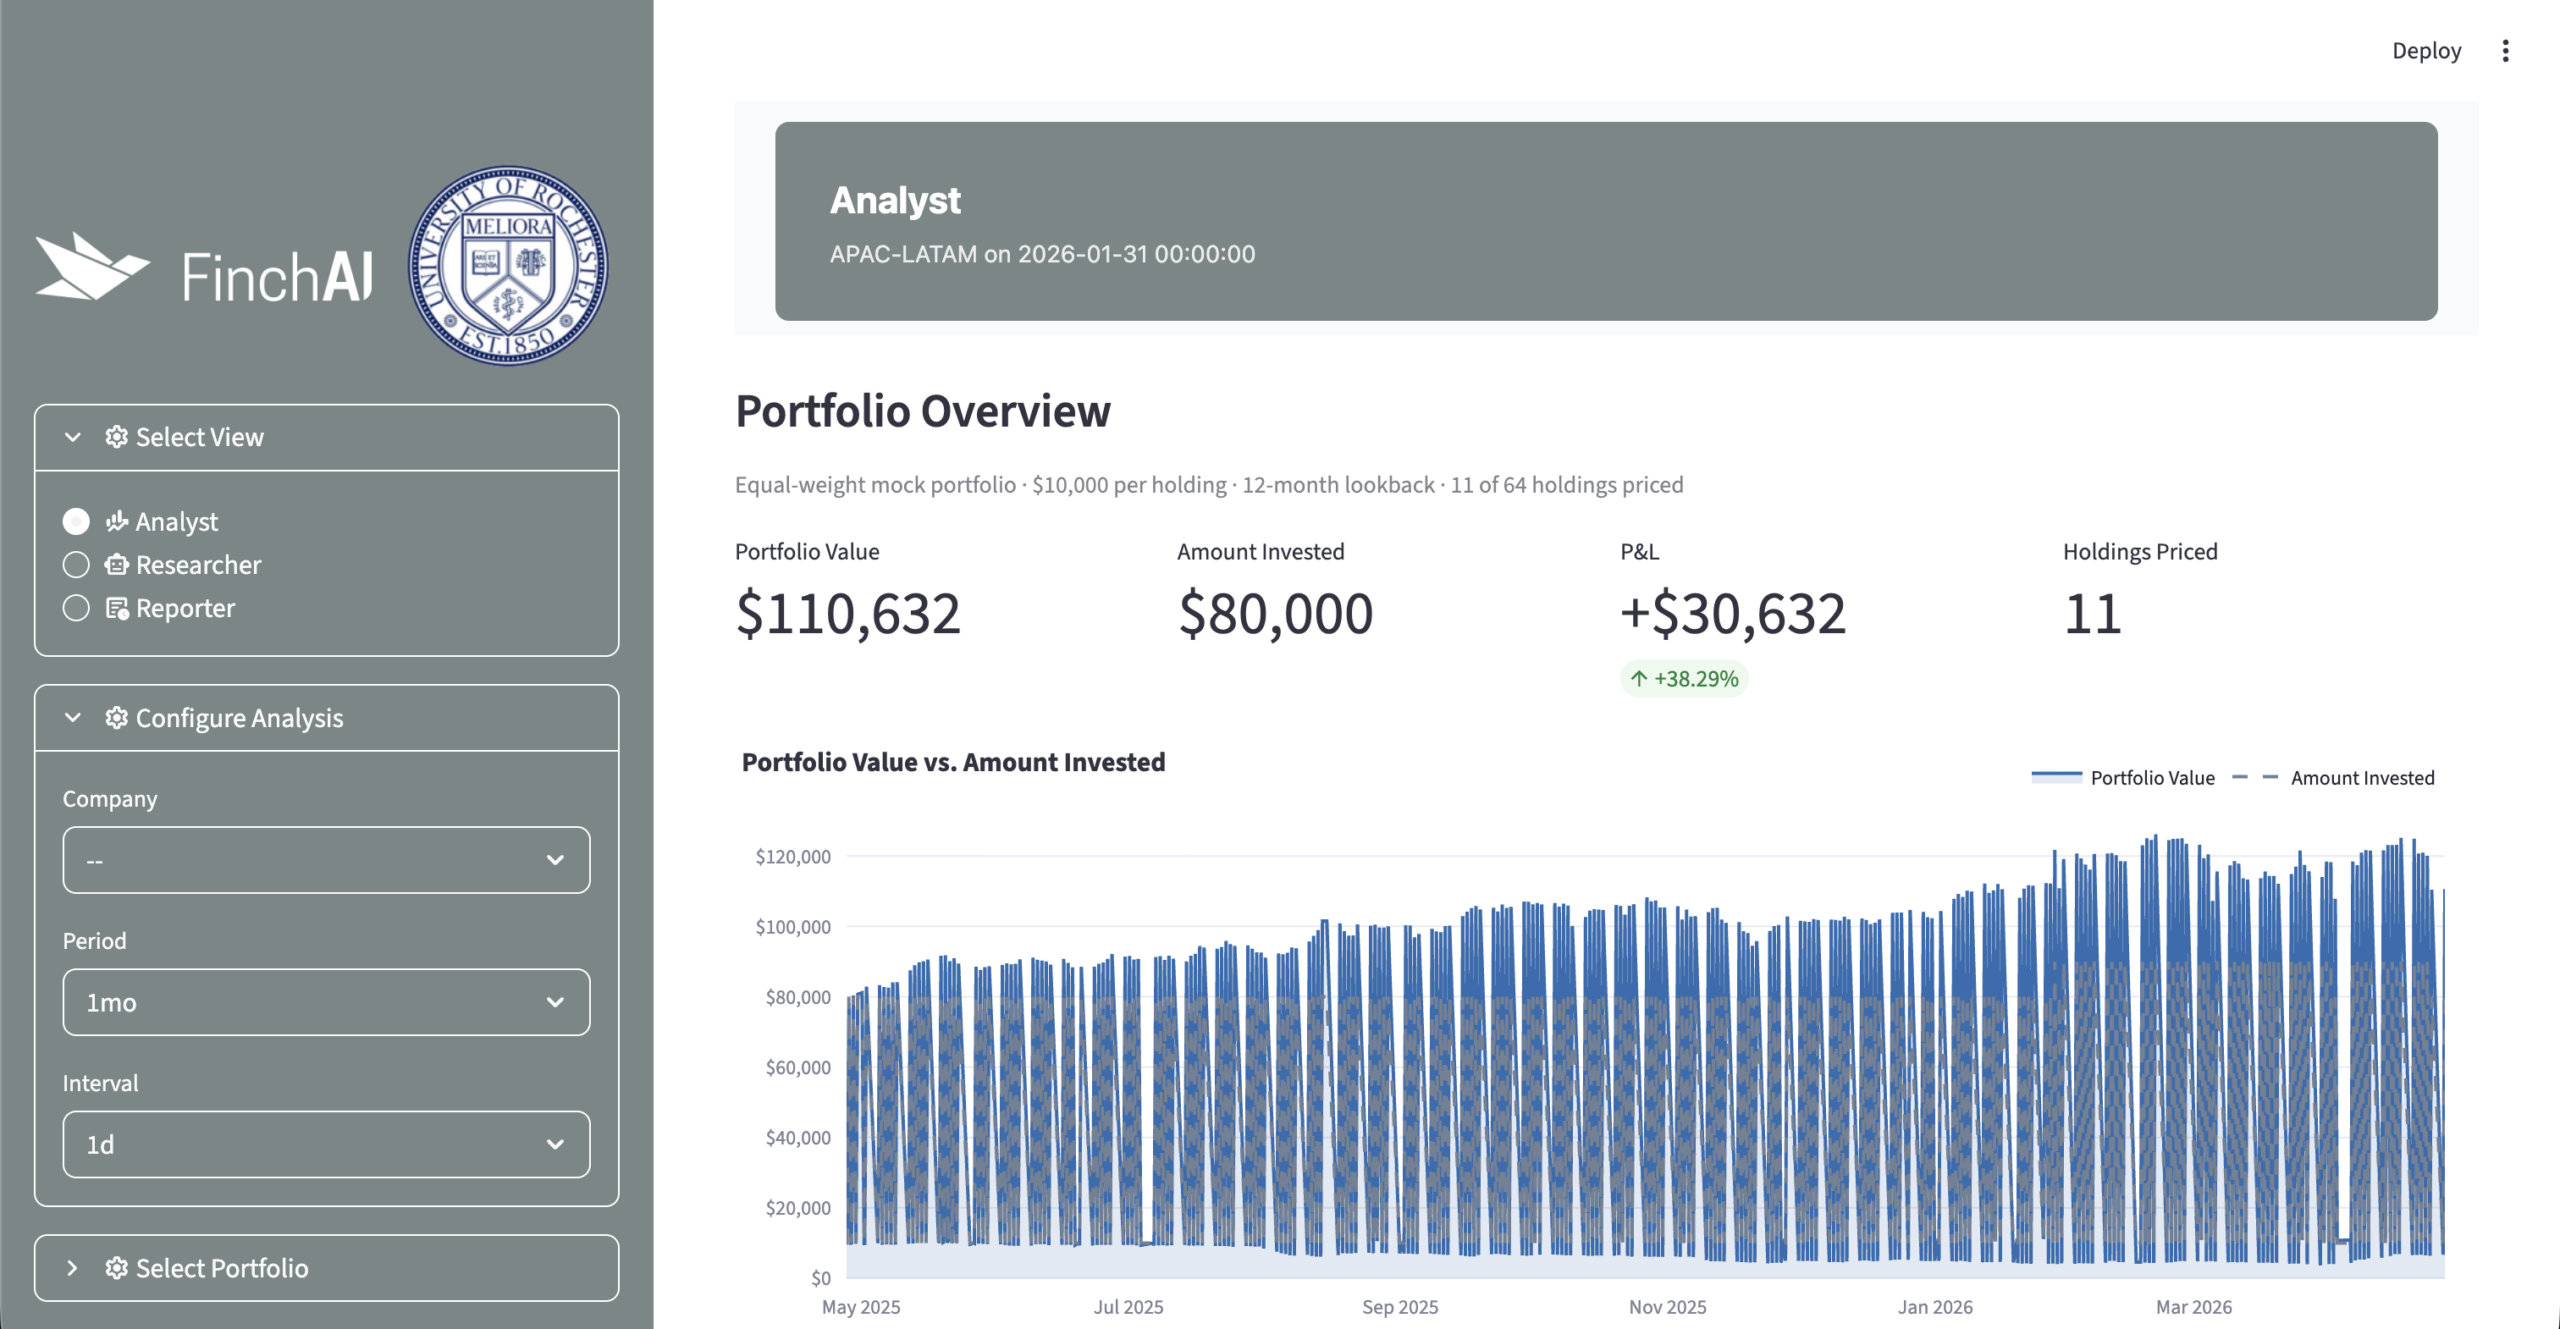
Analyst
The Analyst view gives portfolio managers a quantitative lens on each holding. It pulls historical price data from Yahoo Finance and reports return, volatility, Sharpe ratio, beta, maximum drawdown, and benchmark comparison. The technical analysis panel shows candlestick charts, moving averages, Bollinger Bands, volume, RSI, and drawdown.
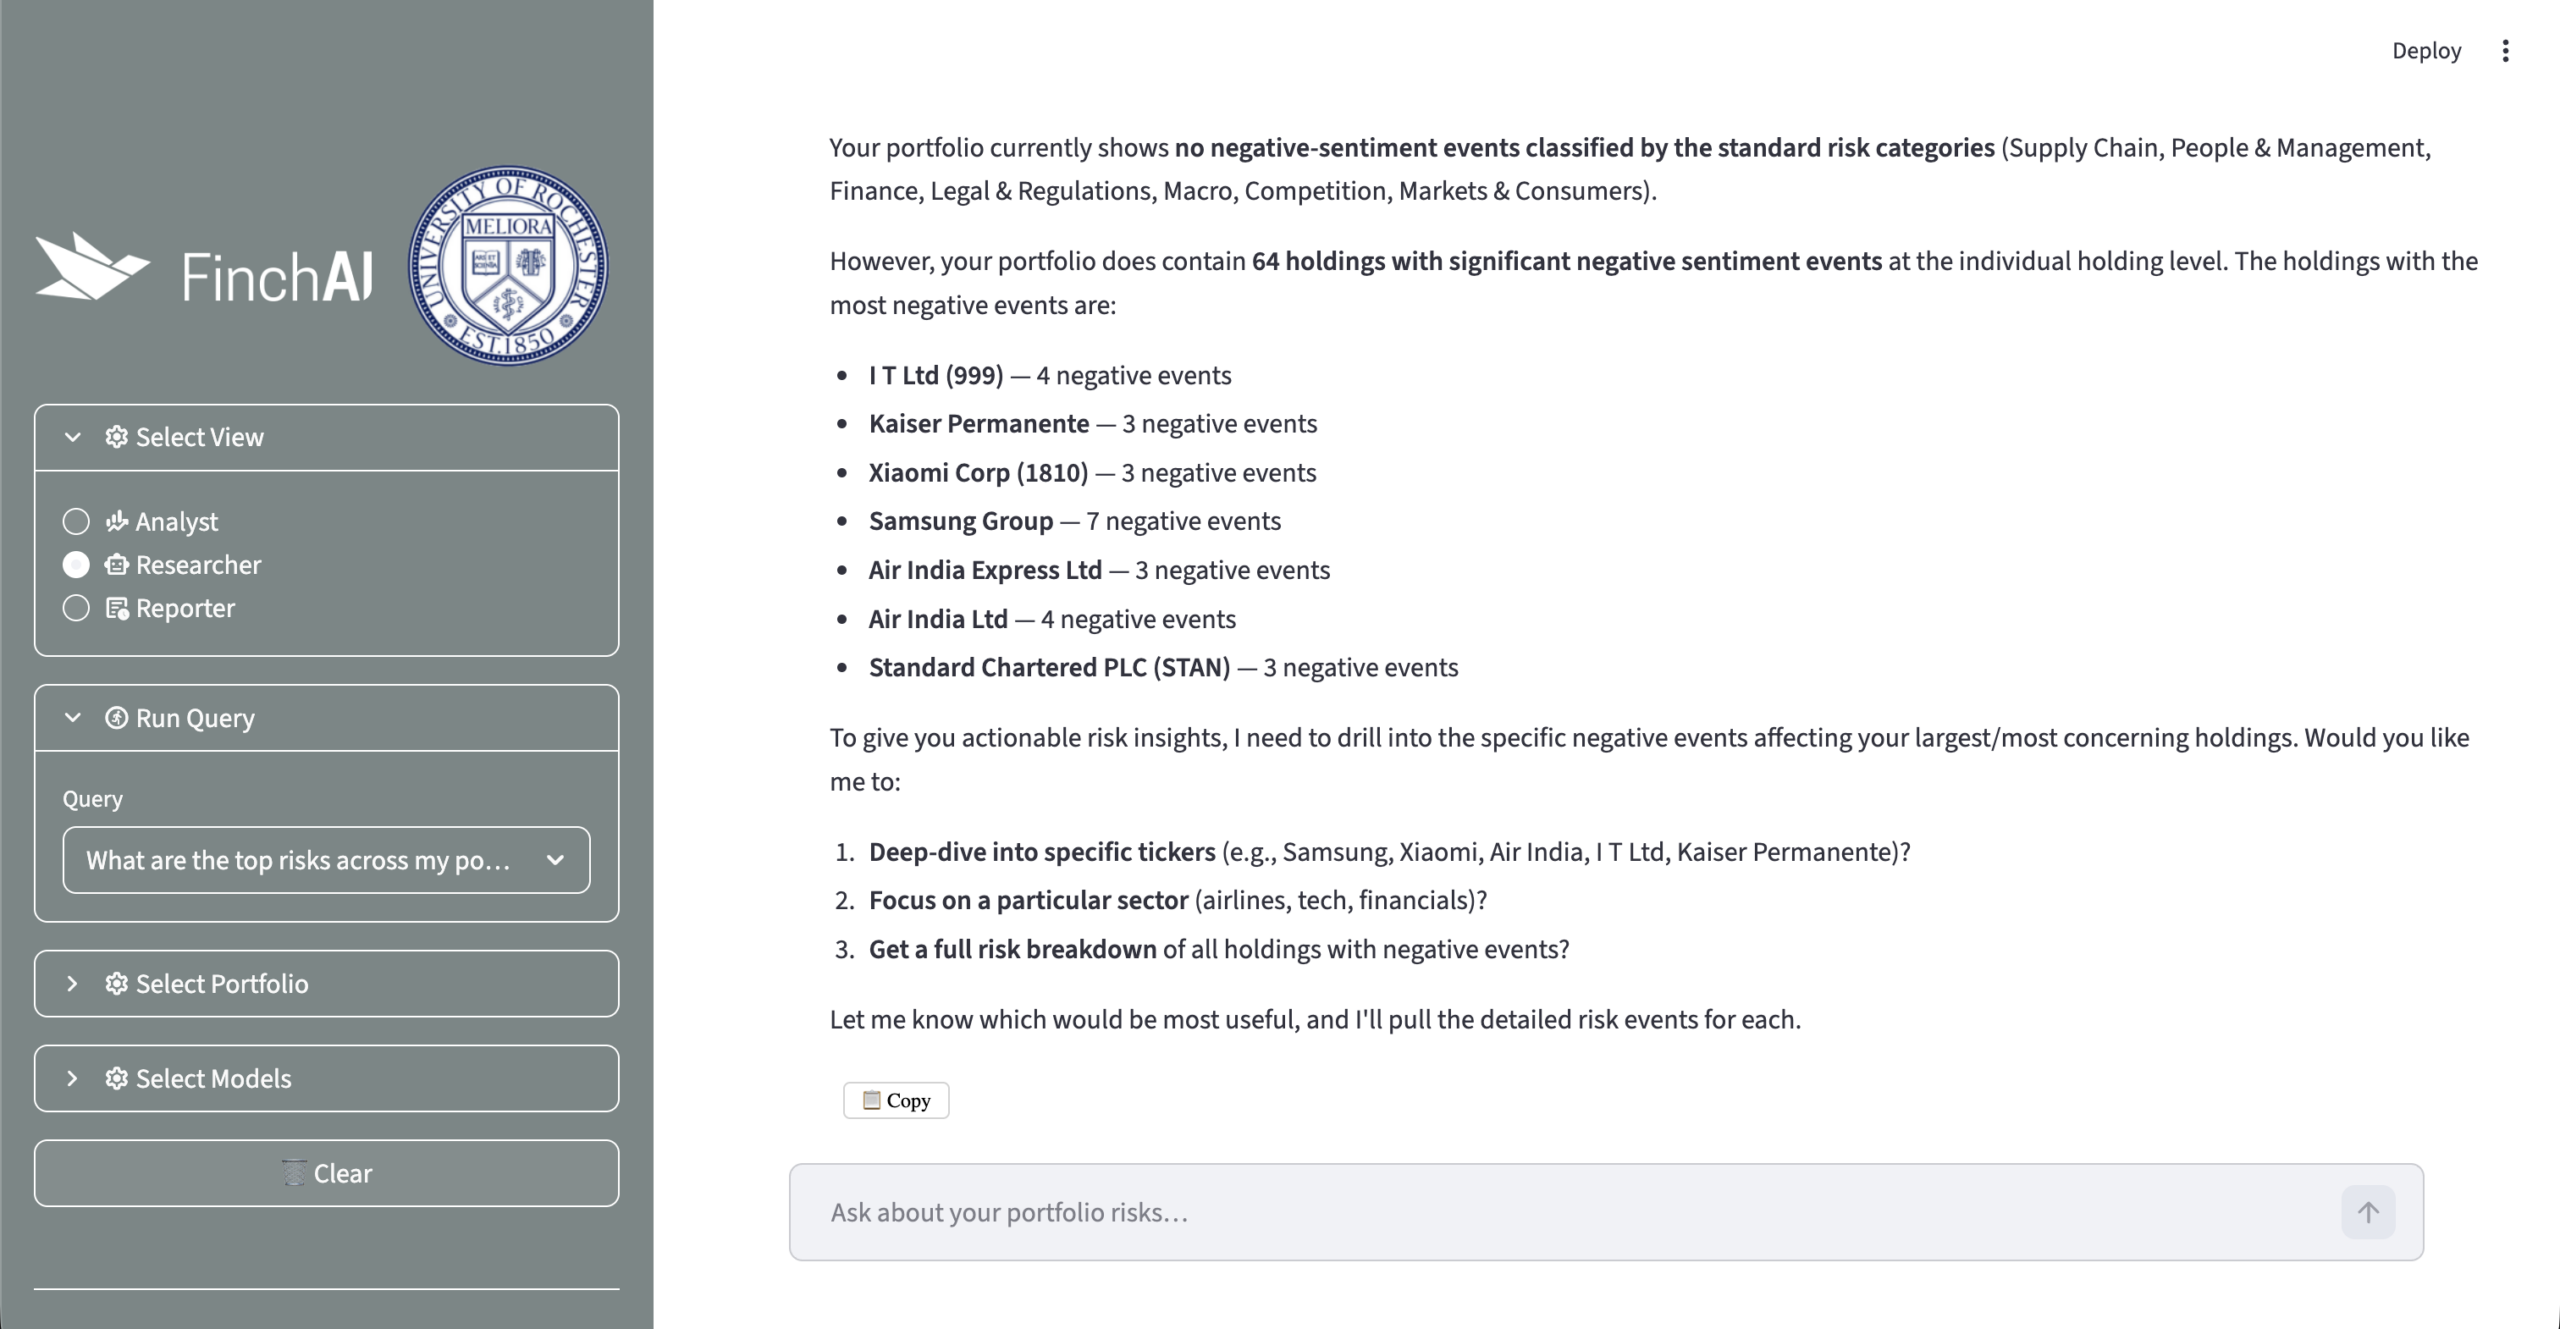
Researcher
The Researcher view supports ad-hoc Q&A for the selected portfolio holdings. It uses a LangGraph deep agent with Tavily web search, so users can ask questions beyond the daily event feed. For example, they can use preset prompts about portfolio risks, regulatory issues, or legal exposure. They can also ask custom questions in free text.
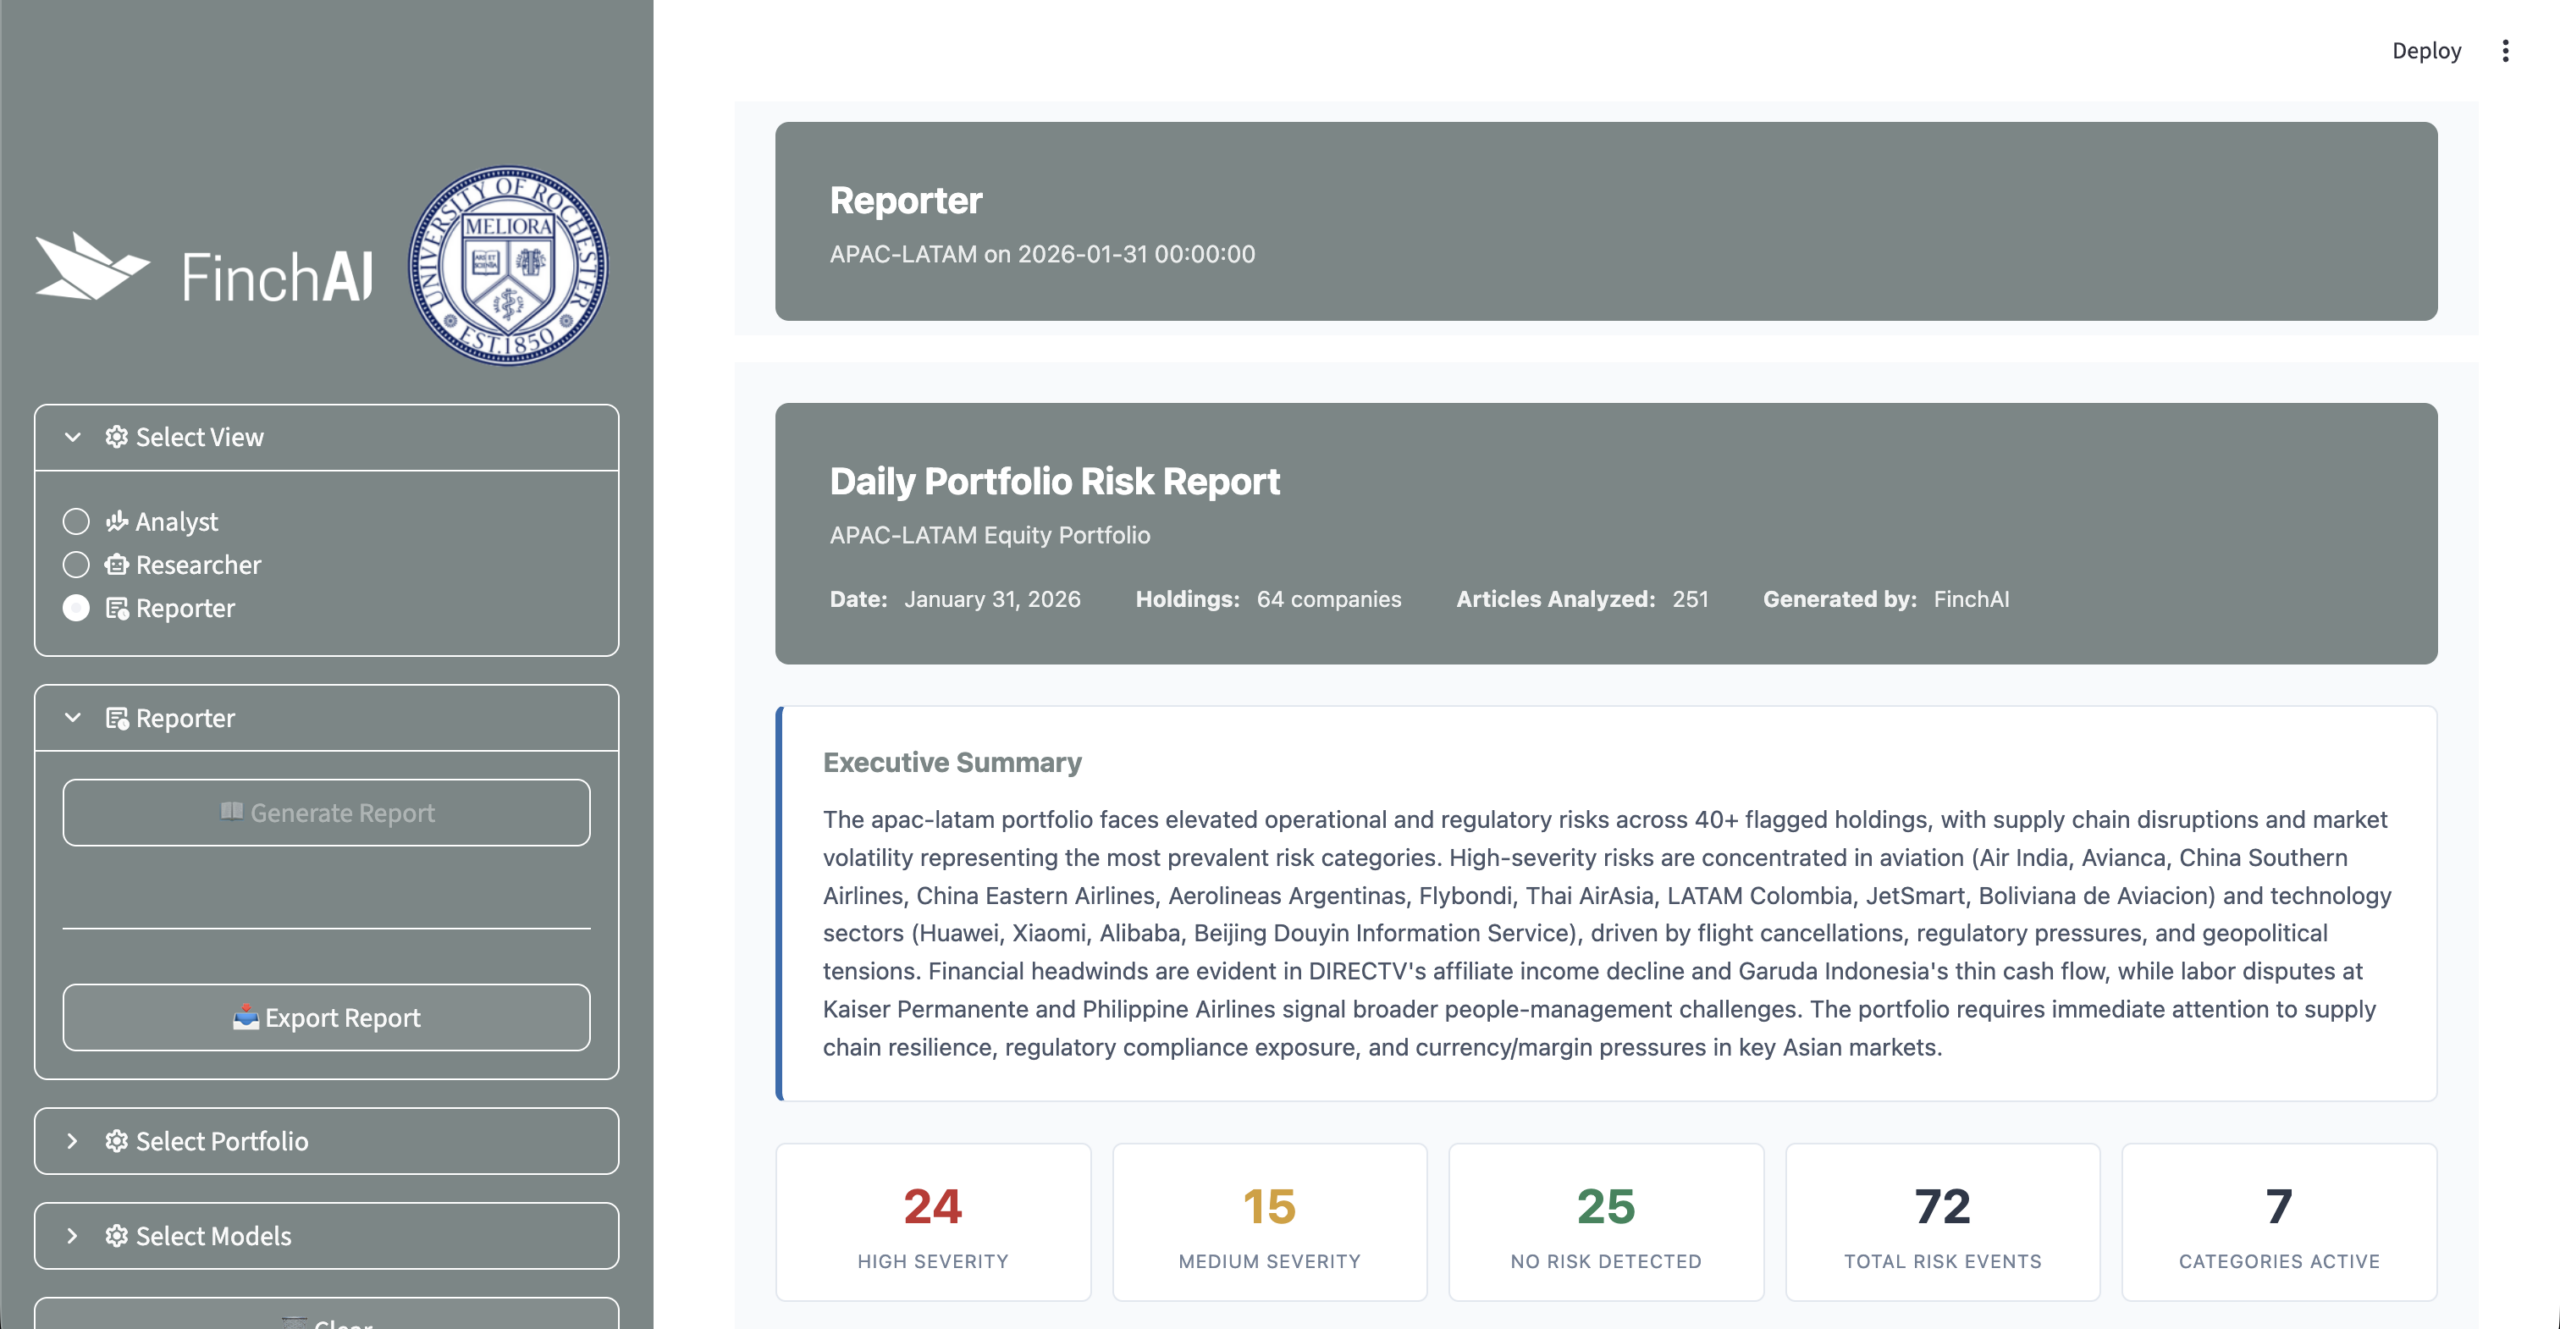
Reporter
The Reporter view generates the downloadable HTML report. The report starts with an executive summary and a severity overview. It then shows a risk-category breakdown with affected holdings, event counts, confidence scores, and trend direction. High-severity company cards show flagged categories, evidence, source attribution, and key concerns. The report closes with a medium-severity table, recommended actions, and a methodology note.
Evaluation
Evaluation focused on three failure modes. First, we checked whether the model hallucinated risks that were not grounded in the source data. Second, we checked whether evidence strings appeared verbatim in the original article summary. Third, we measured whether the system assigned the correct risk categories.
| Classification evaluation set | 165 manually labeled articles across 78 companies |
| Label-wise agreement | Approximately 90% |
| Macro F1 | 0.60 on the positive class |
| Strongest categories | Supply Chain & Product, People & Management, Legal & Regulatory |
| Weakest categories | Finance and Markets & Consumers |
| Analyze-stage grounding | hallucination_check scores clustered between 0.78 and 0.79 across model variants |
Classification Node
We built a manually labeled gold set of 165 articles across 78 companies. The sample came from the APAC-LATAM portfolio and included a mix of event counts and sentiment types. Overall, label-wise agreement between the LLM classifier and the gold reference reached about 90%. Macro F1 on the positive class was 0.60. Evidence faithfulness scored highest because it checks whether quoted evidence appears verbatim in the source. The structured-output prompt and deterministic substring check helped enforce this constraint directly. The model performed best on Supply Chain & Product, People & Management, and Legal & Regulatory. However, it struggled more with Finance and Markets & Consumers because those categories overlap with neutral market coverage and have fewer positive examples.
Analysis Node
For the portfolio-level narrative stage, we used an LLM-as-judge evaluator called hallucination_check. The evaluator reads the generated executive summary and flags risk claims that are not traceable to the structured input. We tested Sonnet 4.6, Gemma 4, and Haiku 4.5. Across all three models, hallucination_check scores stayed between 0.78 and 0.79. The grounding structure mattered more than the model choice at this stage. Most unsupported claims appeared in generic framing sentences, not in specific risk attributions.
Challenges
LLM Output Variability
Because the classify and analyze nodes run as separate LLM calls, company names did not always match exactly between stages. For example, a holding might appear as “Air India Express” in one step and “Air India Express Ltd.” in another. We added fuzzy matching logic to join results without losing evidence or double-counting holdings.
Missing Stock Identifiers
About 52% of records in the FinchAI data feed were missing stock identifiers such as ticker symbol, exchange name, and MIC code. Since not all entities are publicly traded, we kept those rows for risk analysis, but the gap limits how completely ticker and exchange information can appear in the generated report.
Merging Parallel Results
To speed up classification, the system analyzes many holdings at the same time. This created a coordination challenge: results from separate workers had to merge back into one consistent portfolio report without losing company names, evidence, or risk categories. The pipeline solved this with a state schema that supports structured reductions from parallel workers.
Future Work
Domain Expert Validation
FinchAI domain experts could review evaluation outputs and refine the classification and analysis prompts. This would add financial judgment that an LLM-as-judge evaluator cannot fully capture. It is especially important for Finance and Markets & Consumers, which showed the weakest classification performance.
Multi-Dimensional Evaluation
The current hallucination_check evaluator measures whether narrative claims are grounded in the structured input. Expanding it to score relevance, clarity, and actionability would give a fuller picture of report quality beyond factual accuracy.
Confidence Score Calibration
The current confidence scores come from the analysis layer. Future work should calibrate them against more labeled examples or realized outcomes. Validated thresholds would make the category breakdown more reliable for portfolio review.
Trend Detection Across Days
The current system treats each day’s report in isolation. Multi-date portfolio state would let the pipeline detect escalating risks across consecutive reports. For example, it could flag a holding that appears in the same risk category for three days in a row.
Conclusion
This project shows that daily portfolio risk review can be accelerated without giving up structure or traceability. By combining LLM-based classification with deterministic aggregation and source-grounded reporting, the system turns scattered company news into a report that highlights material risks, affected holdings, supporting evidence, and recommended actions. The result is a workflow that helps portfolio managers move from manual article review to faster, more consistent portfolio-level risk monitoring.
Acknowledgements
We would like to thank Professor Cantay Caliskan and Professor Ajay Anand for their continuous support and mentorship. We also thank Robert Flagg and Scott Lightner at FinchAI for their guidance throughout the project.
Sponsor
FinchAI
Robert Flagg
rflagg@finchai.com