Corporate Linkage Detection
“A Three-Stage Stacked Machine Learning Pipeline for Detecting and Classifying Company Ownership Relationships.”
Group 6 · Rel8ed Alvin Yao · Grayson Gong · Alex Li · Frank Peng University of Rochester · In collaboration with Rel8ed.to
Meet the Team
Alvin Yao
Model Training & Evaluation
Developed performance diagnostics and visualized stage-by-stage model behavior. Authored the next-steps and challenge discussion.
Grayson Gong
Pipeline Architect
Designed the three-stage hierarchical classifier, engineered pairwise relational features, and built the controlled negative-sampling scheme.
Alex Li
Error Analysis Lead
Diagnosed the binary-stage bottleneck, identified the most-confused class pairs, and translated the confusion matrix into actionable insights.
Frank Peng
Data Engineering
Improved the preprocessing pipeline, designed the overall system architecture, and ensured consistent train/validation/test partitioning.
Vision & Goals
Recent suspension of U.S. beneficial-ownership enforcement has weakened centralized transparency, leaving fragmented public registries as the main lens into hidden corporate structures used for tax evasion, money laundering, and shell companies.
- Detect relationships
- Classify relationship type
- Refine hierarchy depth
Data Overview
The GLEIF LEI Dataset
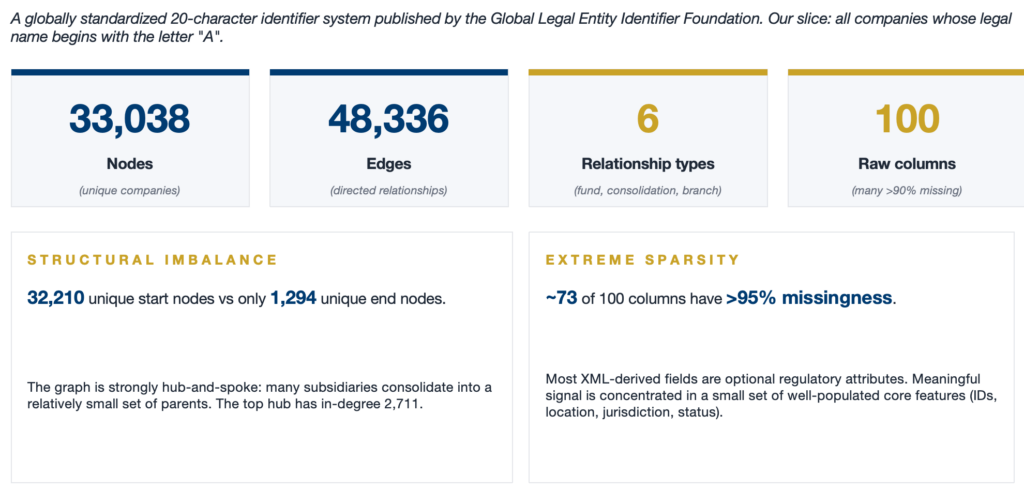
EDA · Missing Data Profile
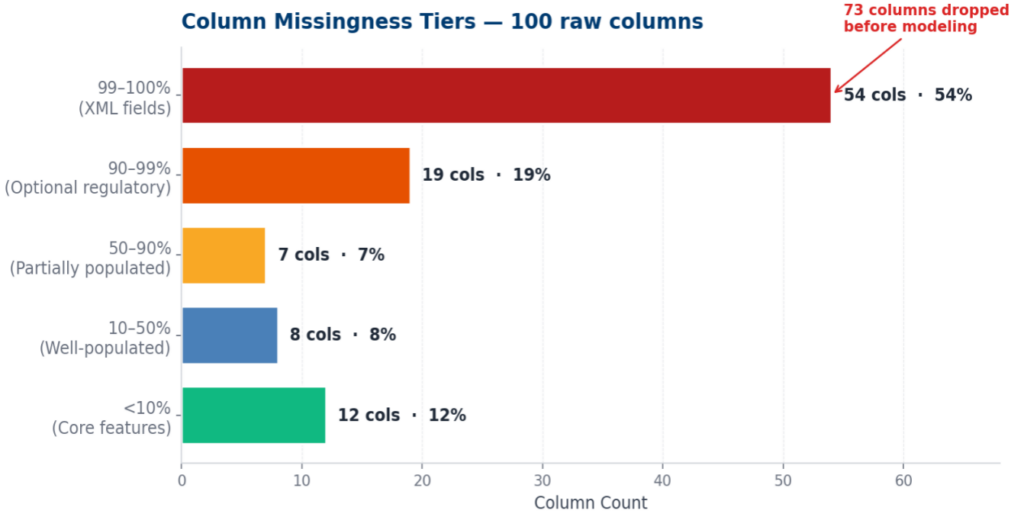
Our dataset came in with 100 raw columns, but the missing data was extremely skewed.
73 columns had over 90% missing values — 54 of them were XML-derived fields that were basically empty (99–100% missing), and another 19 were optional regulatory attributes. We dropped all 73 noisy columns before modeling to keep things clean.
For the remaining features we used a simple, effective imputation strategy:
- Categorical variables → filled with “UNK” (preserves the “missing” signal without inventing fake relationships)
- Numerical variables → filled with 0 or the median, depending on context
EDA · Geographic Distribution
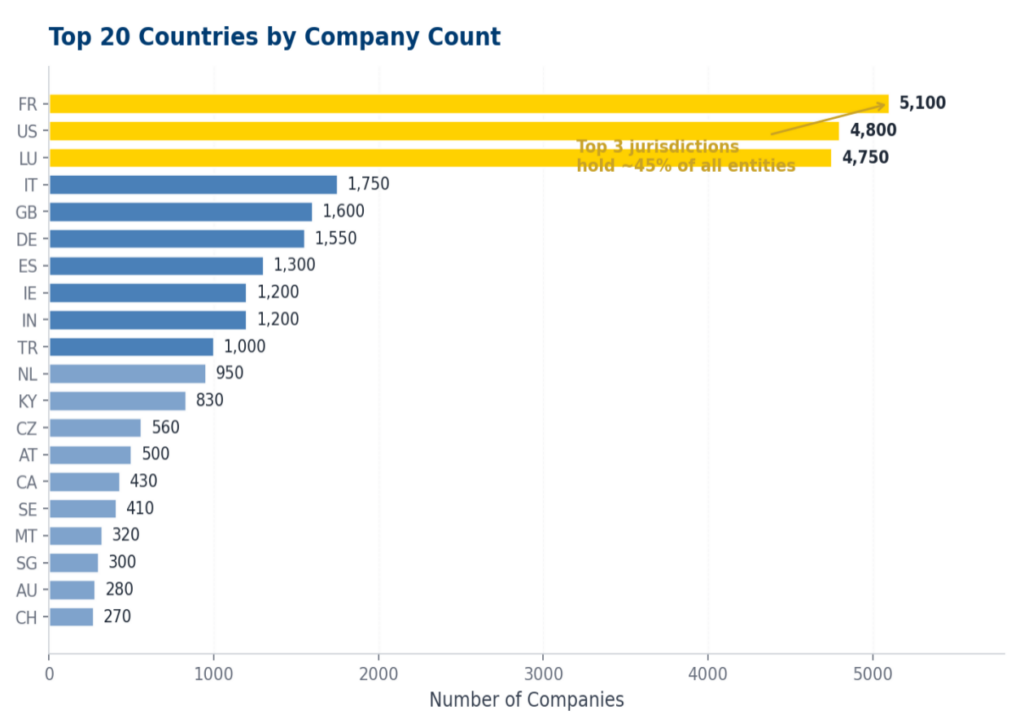
Takeaway: geography alone carries real signal — same-country pairs are far more likely to be linked.
- Financial hub concentration
- Long tail of jurisdictions
- Offshore signals
EDA · Relationship Types
CONSOLIDATED 46.3%
Directly + Ultimately
Consolidated By
INDIVIDUAL 53.4%
Fund Managed By,
Subfund Of
OTHER_RARE. 0.3%
Feeder To, International
Branch Of
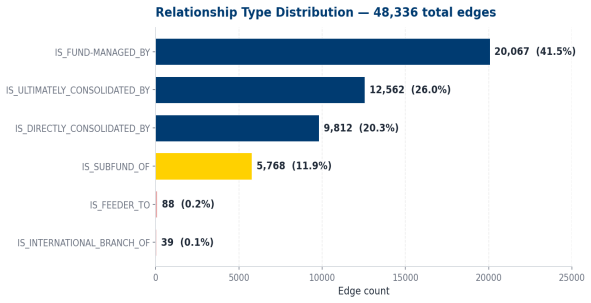
Severe class imbalance: IS_FUND-MANAGED_BY alone is 41.5% of edges, while IS_FEEDER_TO and IS_INTERNATIONAL_BRANCH_OF together account for just 0.3% — this drives our two-tier design.
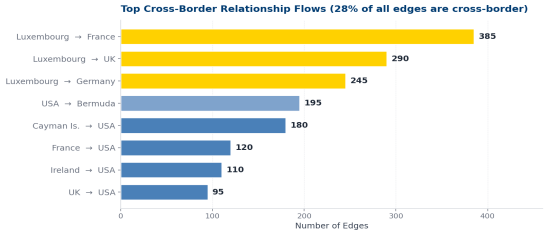
EDA · Network Structure
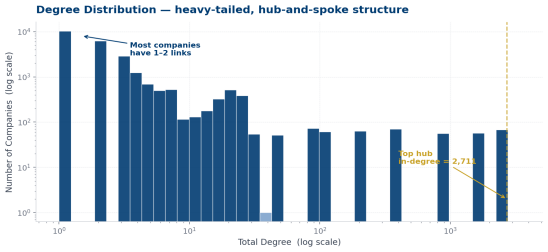
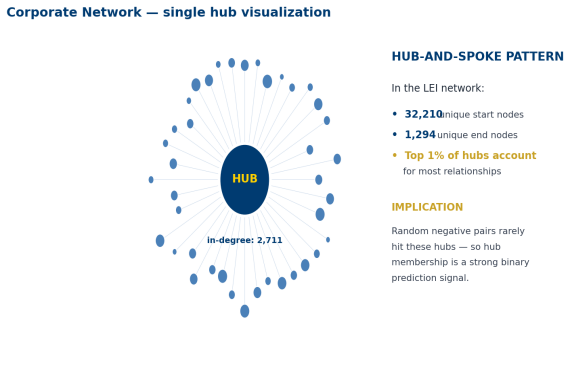
• Power-law distribution — few hubs, many leaves
• ~72% domestic relationships, 28% cross-border
• Luxembourg acts as a major international intermediary for fund structures
Methodology
System Architecture
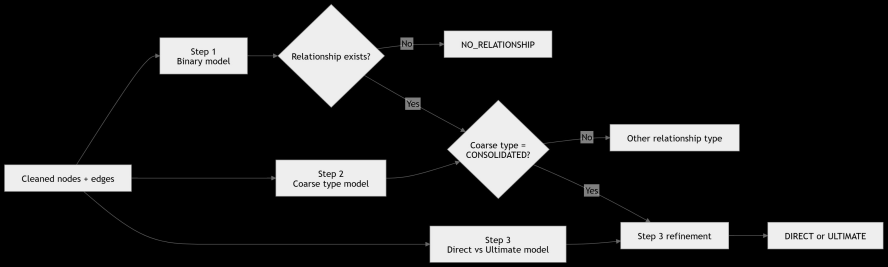
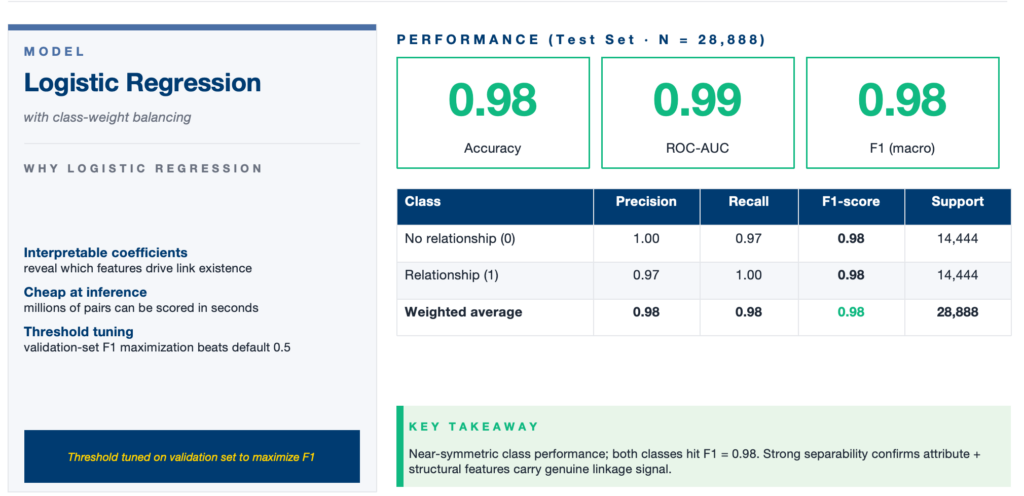
Stage 1: Binary Detection
Logistic Regression predicts whether any relationship exists between a company pair. If NO → pipeline stops.
XGBoost assigns a coarse category (CONSOLIDATED / INDIVIDUAL / OTHER_RARE) to all positive pairs.
Stage 2: Coarse Type Classifier
Stage 3: Direct vs Ultimate
Specialist XGBoost uses hierarchy-graph features to separate direct from ultimate consolidation.
Data Preparation & Train / Test Split
PREPROCESSING PIPELINE
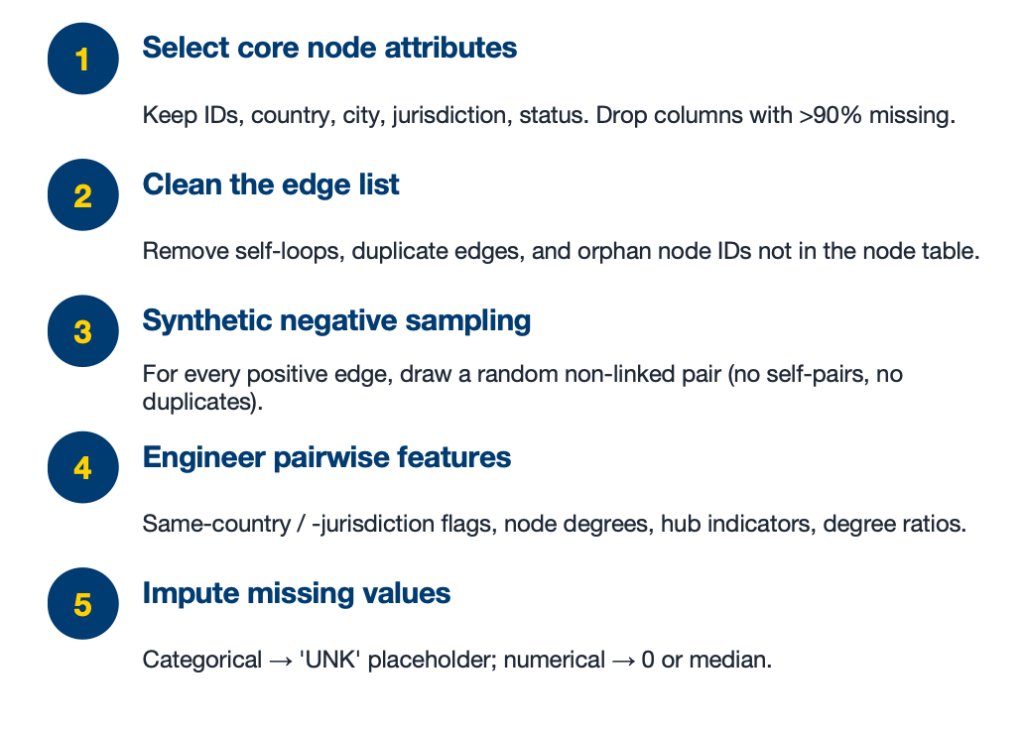
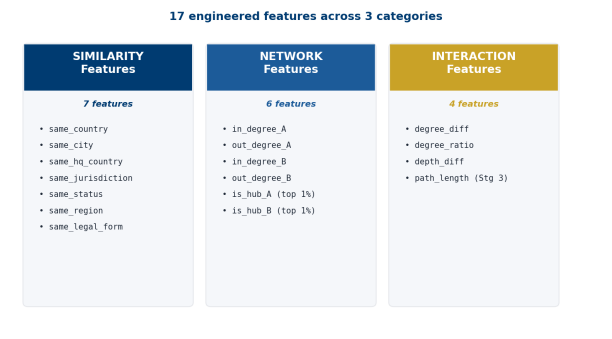
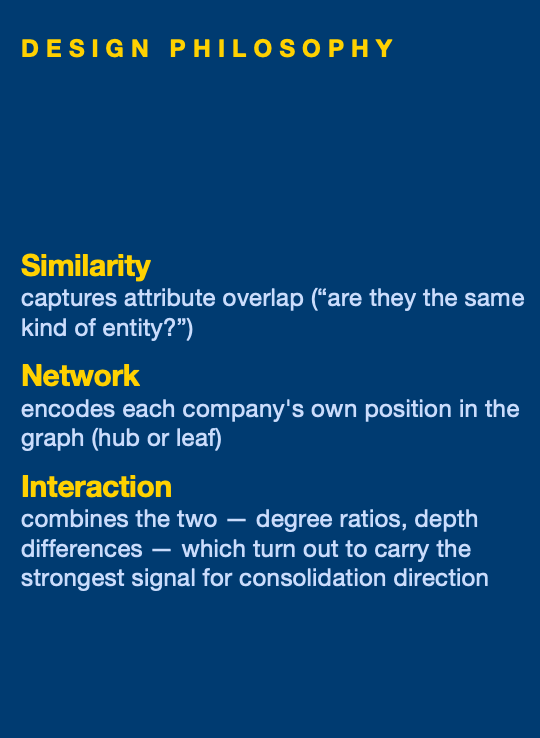
Feature Engineering
Engineered 17 pairwise features combining company attributes with graph-derived signal. Every feature operates on a (Company A, Company B) pair, not single entities.
Stage 1 · Binary Link Prediction
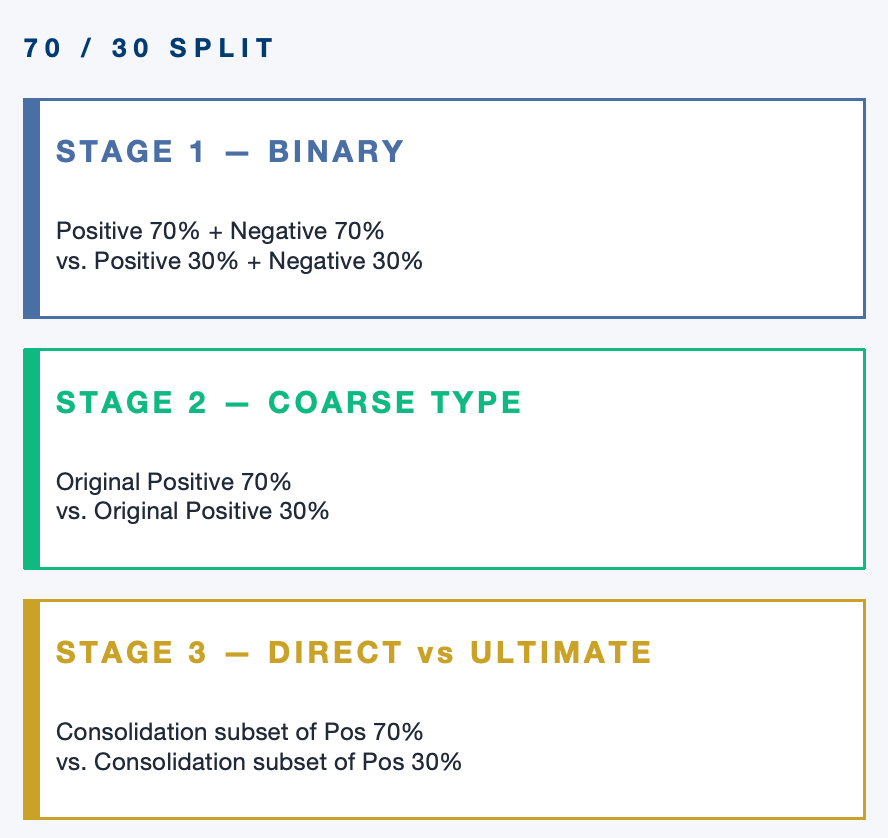
The modeling process begins by constructing a binary classification dataset. Existing relationships are treated as positive samples, while an equal number of synthetic negative pairs are generated by randomly pairing companies that do not have an observed relationship, ensuring no self-pairs or duplicates. Both positive and negative samples are split into training, validation, and testing sets following a 70% / 20% / 30% structure, where the validation set is used for tuning.
Stage 2 · Coarse Type Classification
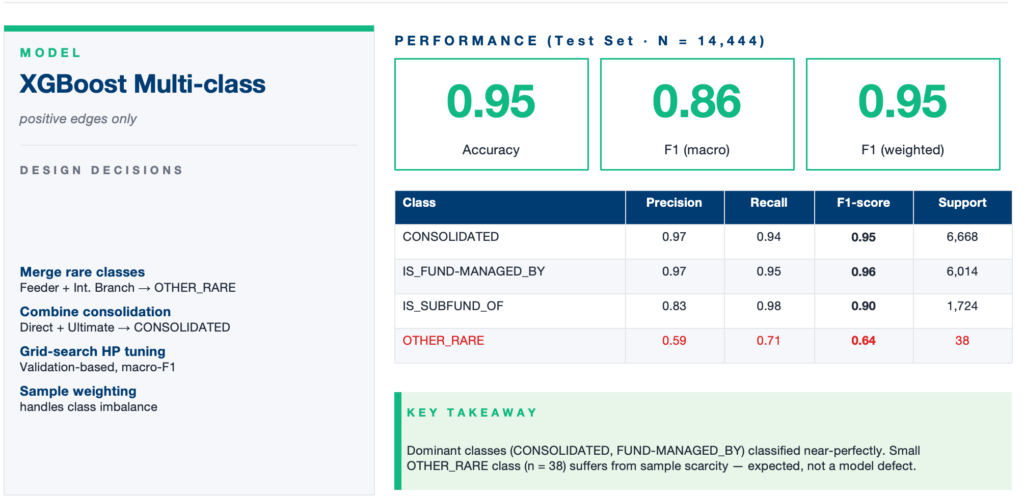
For pairs predicted as having a relationship, a second model is trained to classify the general type of relationship. This model uses only positive samples from the dataset. To simplify the classification task, rare relationship types are grouped into an Other Rare category, and both direct and ultimate consolidation relationships are combined into a single Consolidated class.
Stage 3 · Direct vs Ultimate Consolidation
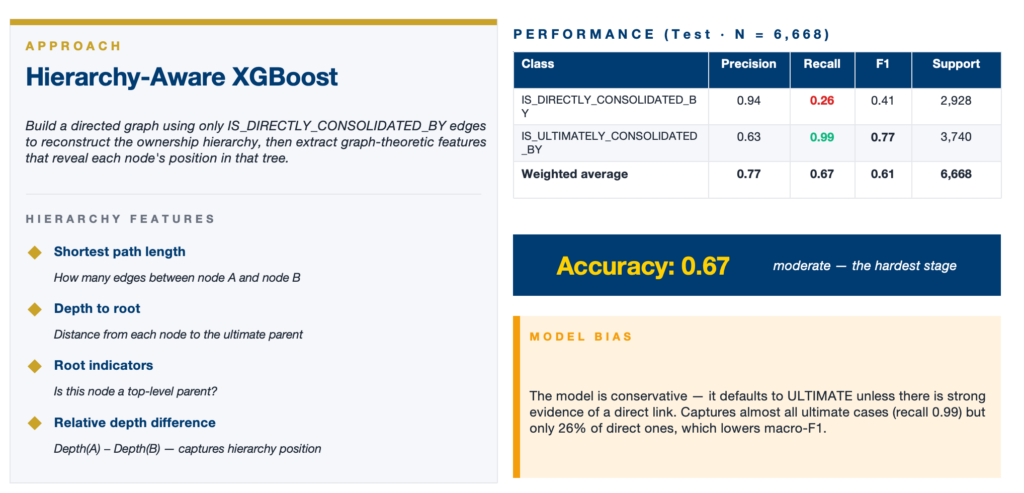
A third specialized model is introduced to distinguish between direct and ultimate consolidation relationships within the subset classified as Consolidated. First, a directed graph is constructed using only direct consolidation relationships, representing the hierarchical structure of company ownership. From this graph, additional hierarchy-based features are extracted, including node degrees within the direct graph, depth to root (distance to the top-level par-ent), path length between entities, and indicators capturing relative positions in the hierarchy.
Results
Final Stacked System Results
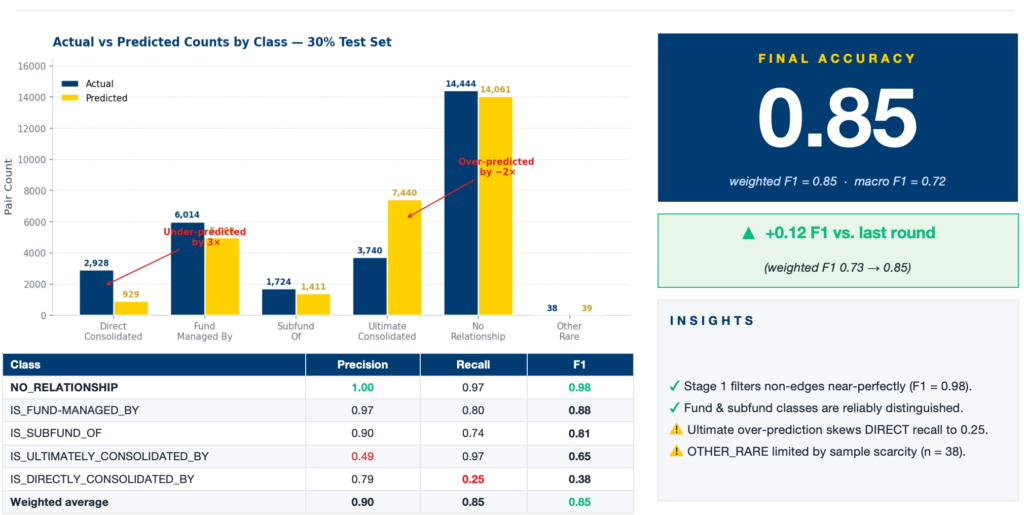
The final stacked system combines all three models and achieves an overall accuracy of 0.852. The system performs exceptionally well on identifying non-relationships, with an F1-score of 0.98, showing that Step 1 effectively filters out invalid pairs. Among relationship types, Is Fund Managed By and Is Sub fund Of are predicted reliably with balanced precision and recall. However, the system inherits the bias observed in Step 3, with strong performance on ultimate consolidation (recall = 0.97) but weaker performance on direct consolidation.
Case Demonstrations · Early Exits
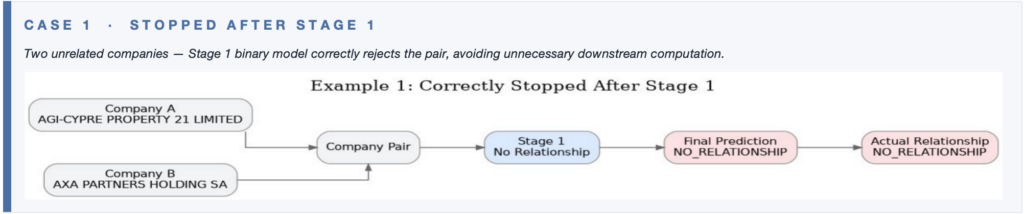
Not every pair goes through all three stages. The stacked design saves compute by stopping early whenever it can commit to a prediction.
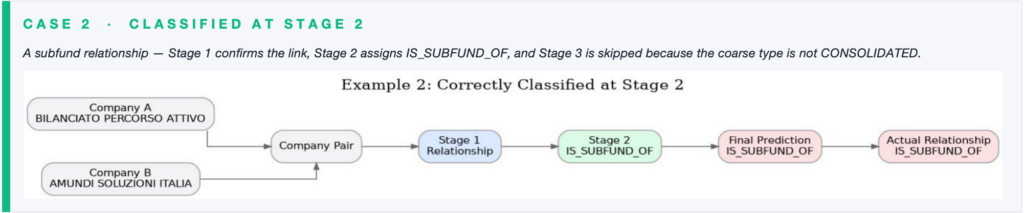
Case Demonstrations · Full Pipeline
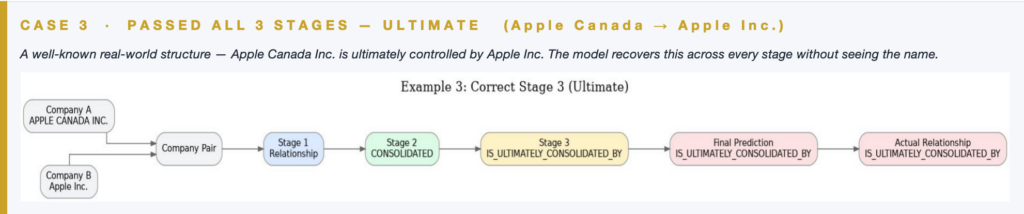
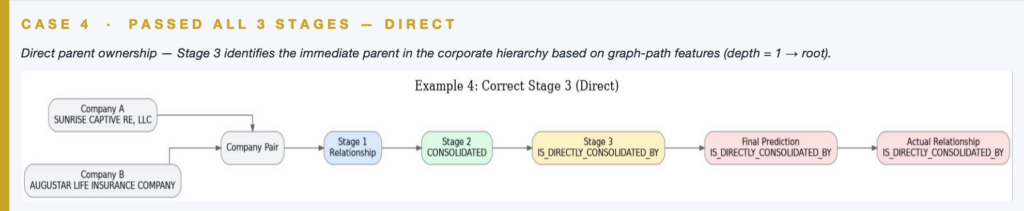
When all three stages run, the specialist Stage 3 model resolves the hardest distinction — direct vs ultimate parent control.
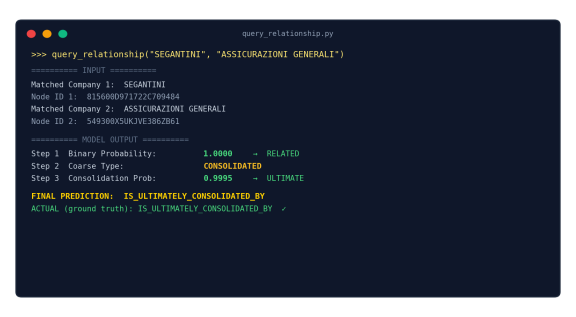
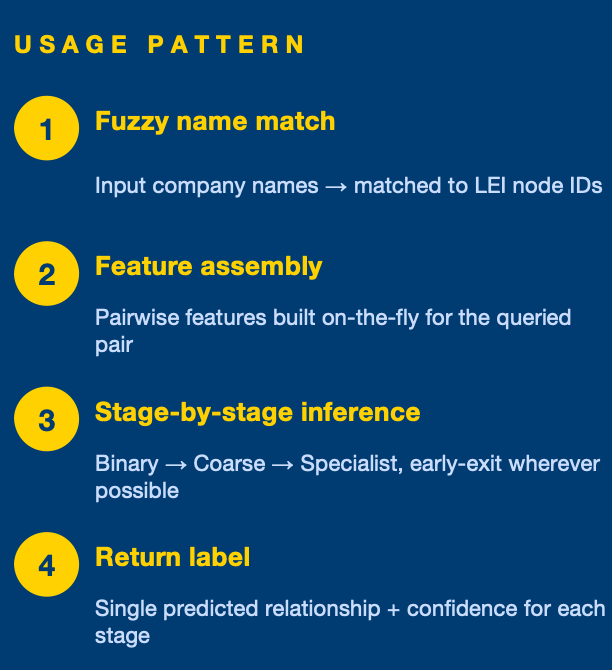
Query Interface · Live Demo
- End users interact with the pipeline through a single function call — the three stages run sequentially and produce a final labeled prediction.
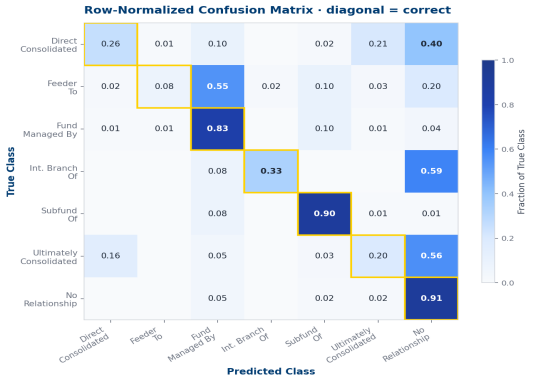
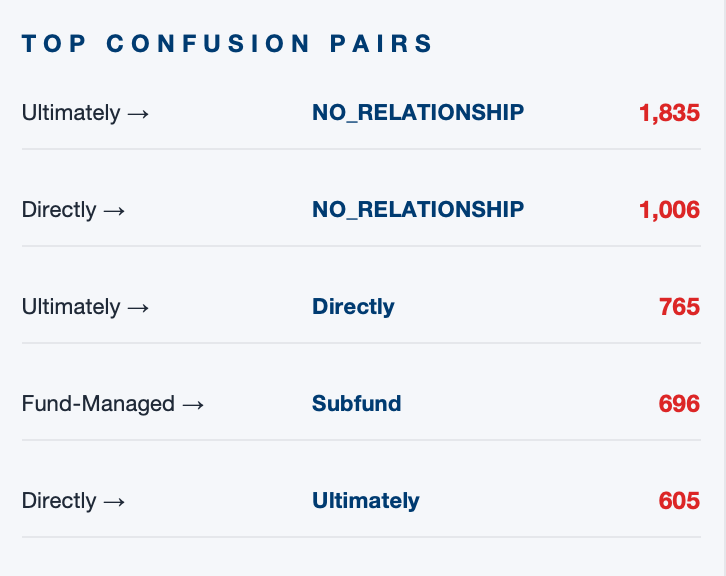
Error Analysis · Confusion Matrix
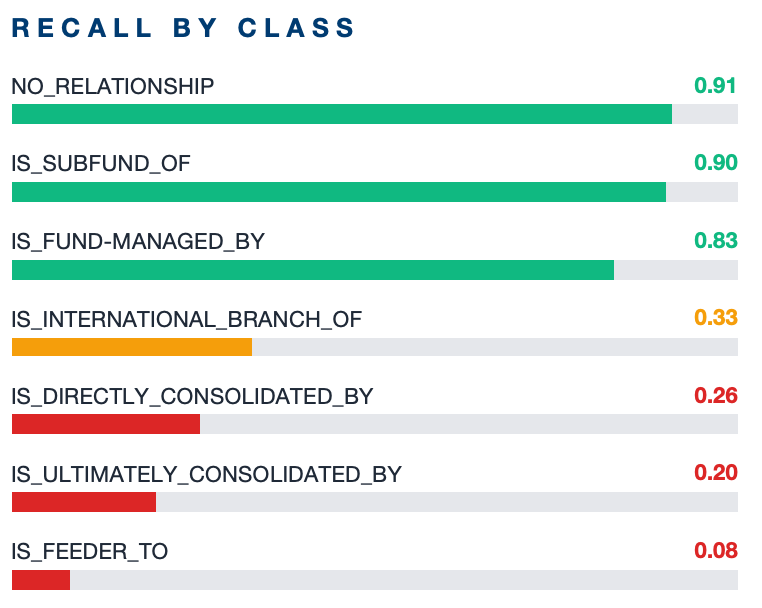
Errors concentrate in 3 difficult classes (consolidation + feeder). Fund-side prediction is near-perfect.
Error Analysis · Stage Bottlenecks
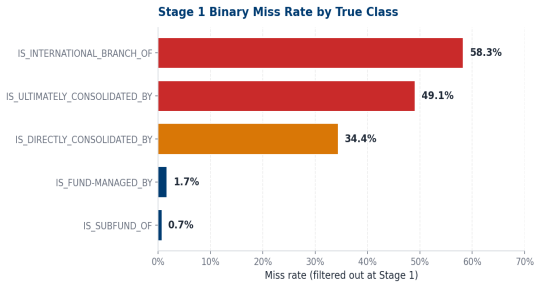
WHERE ERRORS COME FROM:
1. Binary stage filters out ~49% of ultimate and ~34% of direct consolidation pairs too aggressively.
2. At the type stage, DIRECT ↔ ULTIMATE confusion dominates the remaining error mass.
3. Fund-side errors are minor; consolidation-side errors drive the macro-F1 gap.
Challenges & Next Steps
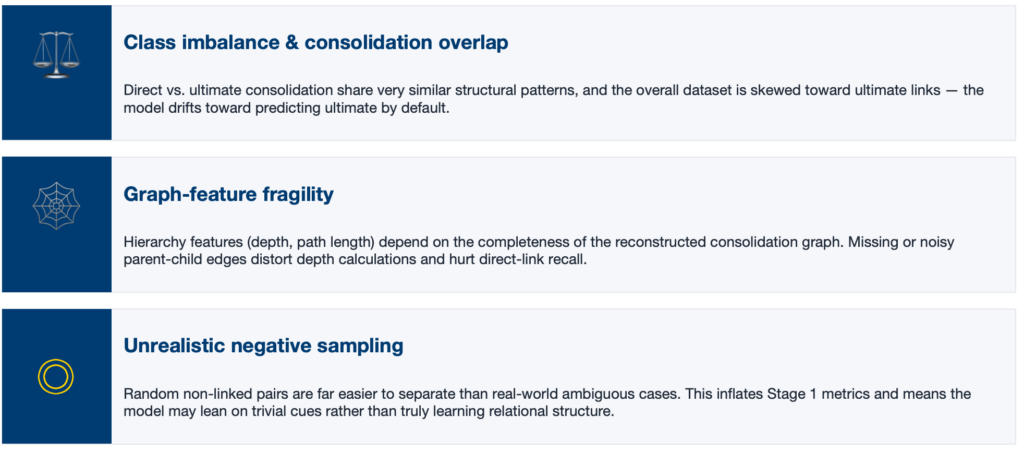
Challenges
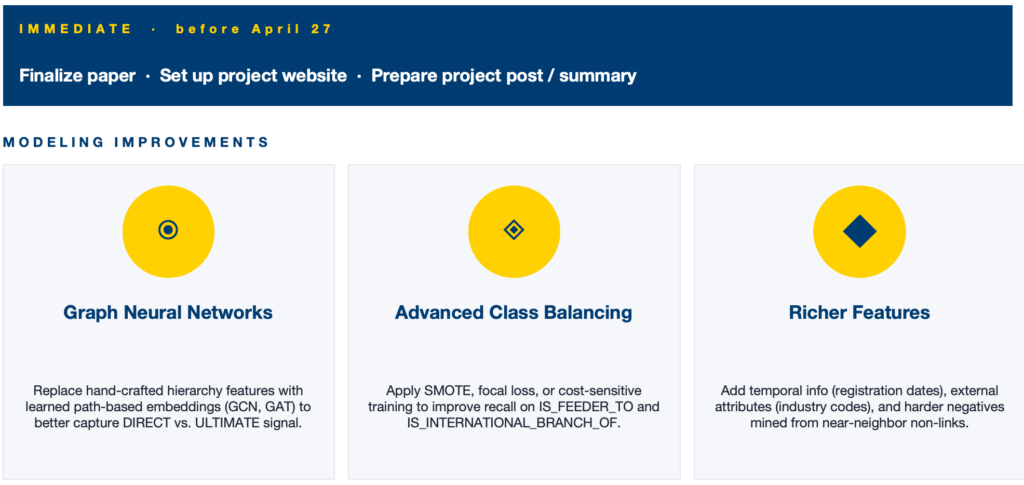
Next Steps & Future Work
Acknowledgements
We would like to thank Professor Anand, Professor Caliskan, and for their guidance and technical assistance. We would also like to thank Team Rel8ed for their expertise with work, and their great help in developing our project pipeline.