A data-driven look at more than 291,000 crashes across twelve years — examining when crashes turn deadly, which roads and jurisdictions carry the highest risk, and whether recent road improvements are making a difference.
GIDS-AI Department
Supervisor: Prof Cantay Caliskan, Prof Ajay Anand
Client: Reconnect Rochester
Authors: Fernando Lopez, Justin Li, Barry Magenya, Cloud Xiao, Songtao Zhang
Introduction
Automobile crashes remain a serious public safety crisis in the United States. In 2024 alone, 39,254 people were killed and more than 2.4 million were injured on American roads. The COVID-19 pandemic made things worse in a counterintuitive way: even as total crashes declined due to less traffic, road fatalities rose especially for pedestrians and cyclists. Compared to peer nations, the United States performs poorly: the U.S. sees 11.6 road deaths per 100,000 people, against 1.6 in Norway and 2.4 in the U.K. and Japan.
Within this national context, Rochester-based transit advocacy group Reconnect Rochester commissioned this analysis of crash data for Monroe County, covering 2012–2024. Their goals were specific: understand the role of time of day, jurisdiction, specific road corridors, and the effectiveness of recent road safety projects.
Throughout this report, special emphasis is placed on vulnerable road users (VRUs) — pedestrians, cyclists, skaters, and others not in motor vehicles — and on fatal and serious injuries (FSIs) rather than raw crash counts, in alignment with Rochester’s Vision Zero policy.
From the database, it is determined that crashes are a common and sometimes fatal problem in Monroe County. Out of 291634 crash cases from 2012-2024, at least 6219 people were seriously injured & 585 were killed in car accidents. Vulnerable Road Users are everyone who doesn’t use a car: Pedestrians, Skaters, Bikers. Out of the 291634 cases, 6997 (2.4%) involved a Vulnerable Road User. Of those, 163 people died & 970 were seriously injured. We want to analyze where and when crashes in Monroe County occur frequently and most severely for both general and vulnerable populations for a better understanding of how to treat our roads and this issue.
Data and Data Cleaning
The dataset was obtained from the NYS Department of Transportation’s CLEAR database, which aggregates police reports, and was released to Reconnect Rochester via a Freedom of Information Act request. It spans 2012–2024, covers 3,908 roads, and includes 65 variables per record. Because it relies on police reports, the dataset naturally underrepresents crashes that go unreported, a bias that particularly affects pedestrian and bicyclist incidents.
Data from Clear Database collected by local police departments and released via FOIA. Original dataset had 296134 entries, 65 variables from 2012-2024. Data cleaning methods included: street name standardization, fatal and serious injuries focus, focus on vulnerable road users and using ArcGIS for data visualization
Methods
Analysis of time of day was performed using logistic regression. Significance and effect of jurisdiction of roads was analyzed using Kruskal-Wallis/Dunn, Chi-squard, and Cranmer’s V tests. Lastly, corridor location analysis was performed using PCA, Chi-square test, and through mapping using ArcGIS Pro.
Time of Day Analysis
Analysis of how the time of day relates to the likelihood of a crash and in the event of a crash what the likely fatal/serious injury rate is.
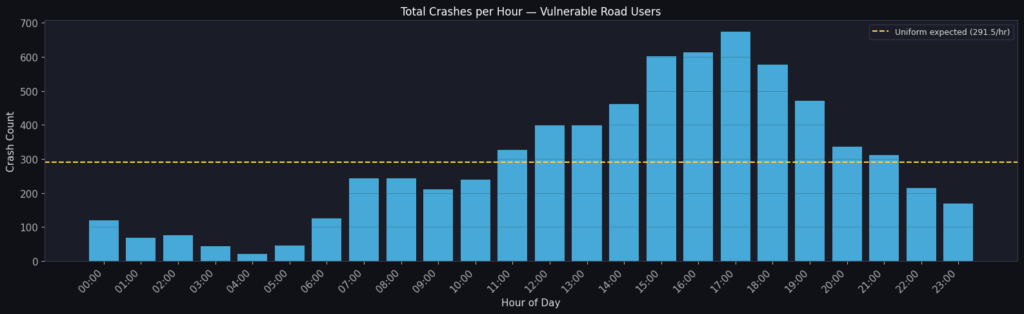
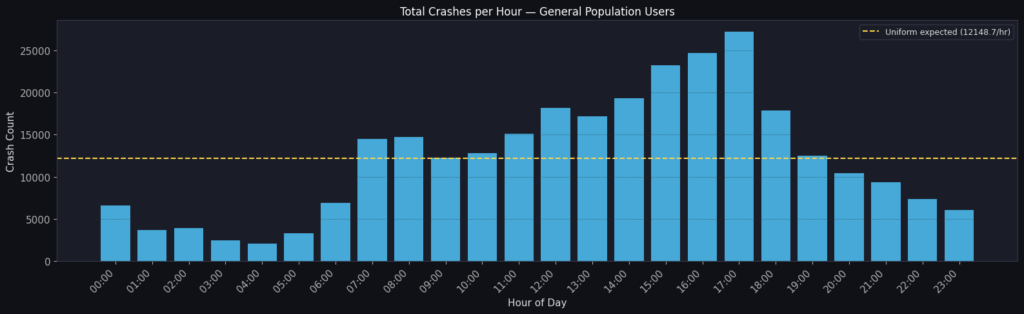
Both the general population and VRUs show crash-count peaks around 3-5:00p.m, a classic rush-hour pattern. However, when examining Fatality and serious injury (FSI) rates rather than raw counts, a very different picture emerges: the peak is observed at night time, between 1-3:00a.m
These figures show the total crashes per hour for both vulnerable road users and general population users.
The figures below show the rate of fatal/serious injury(FSI) for general population and vulnerable road users
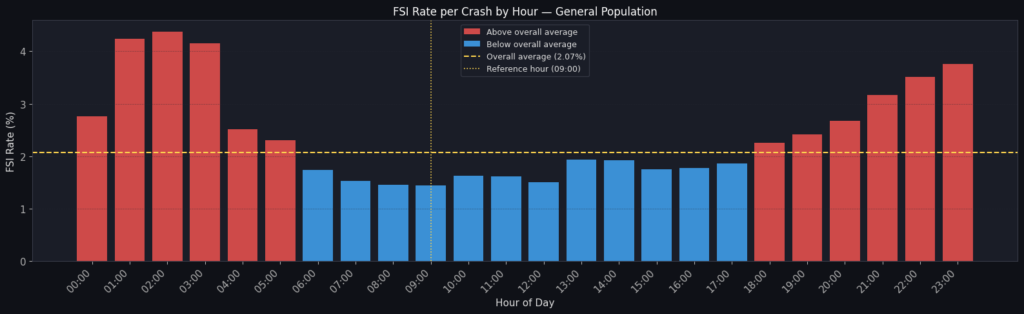
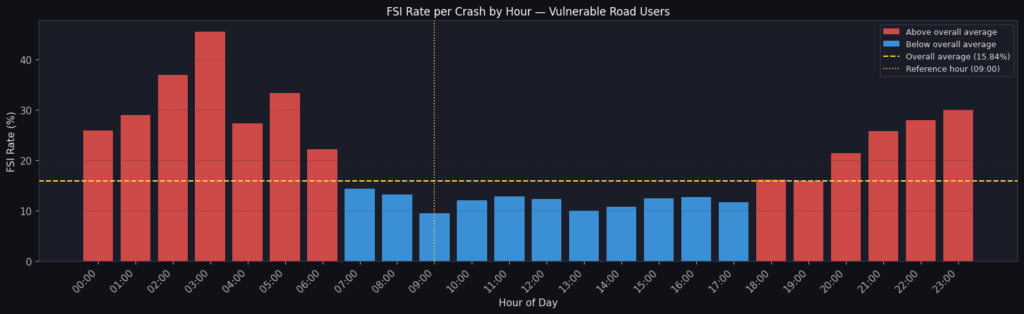
To confirm these patterns statistically, a binary logistic regression was applied to model the conditional probability of a crash resulting in an FSI. Hour of day was treated as a categorical predictor with 24 levels; 9:00 AM (the hour with the lowest FSI rate) was used as the reference category. Log-odds ratios were plotted for each hour.
The following figures show the results for general population and vulnerable users population
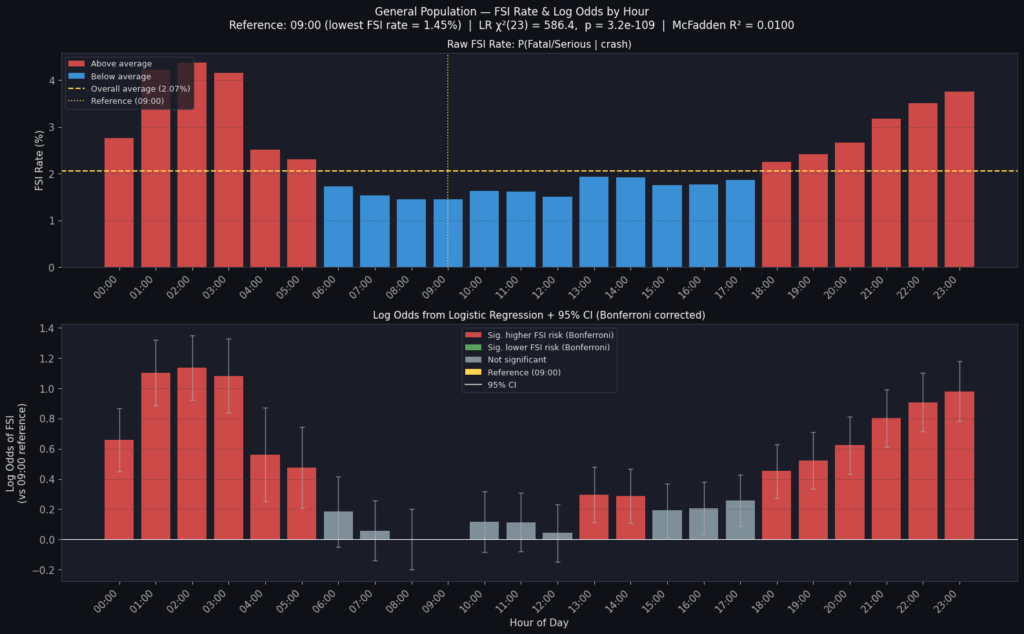
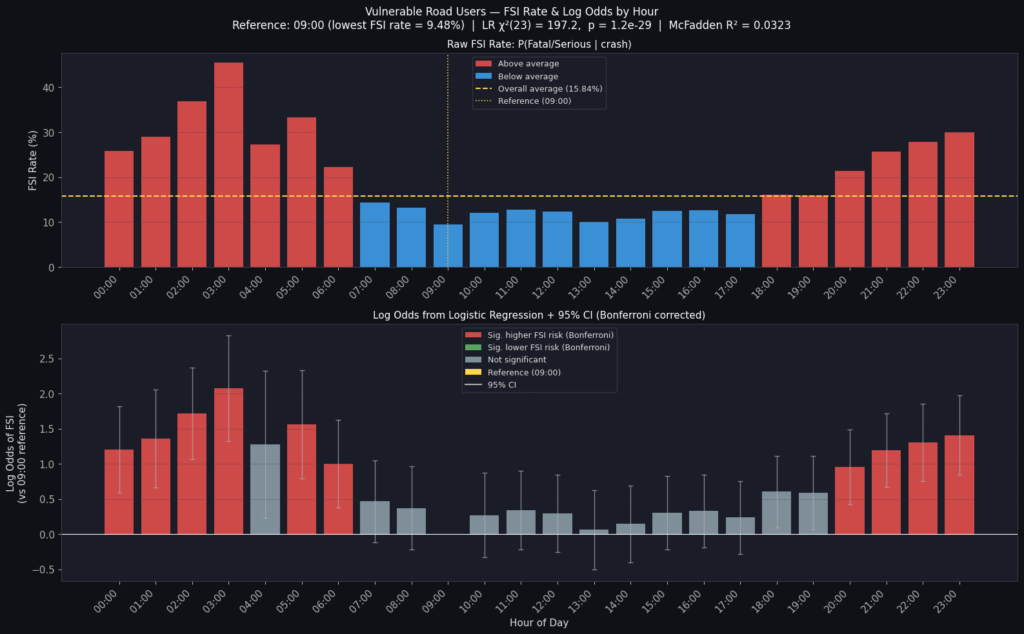
These findings show that if a crash happens in the night times, the people involved in the accident are more likely to be seriously injured or sustain fatalities.
Jurisdiction
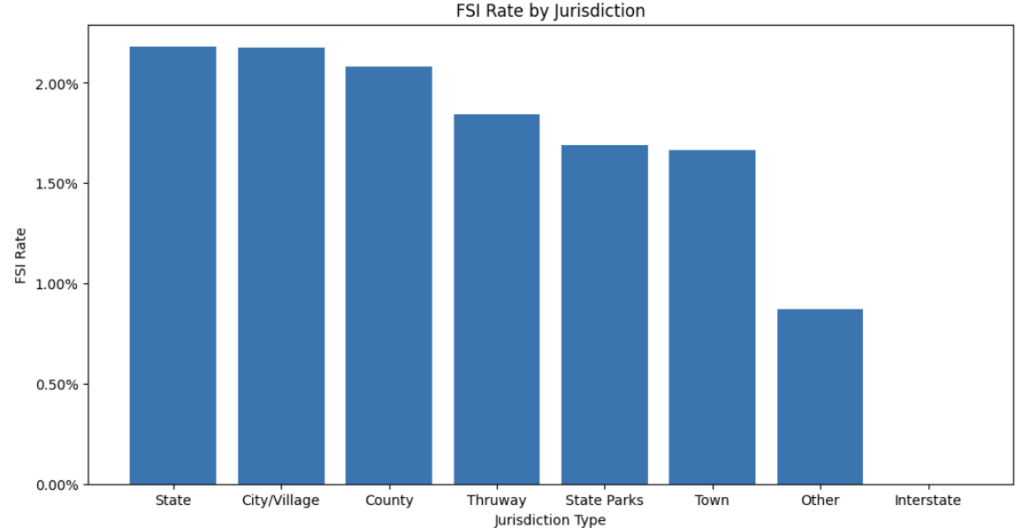
We also explored how different jurisdictions affect crash counts and fatal / serious injuries, especially for vulnerable road users.
Monroe County roads are administered by four primary types of jurisdiction: local towns, the City of Rochester / Villages, Monroe County, and the NYS Department of Transportation (NYSDOT). Reconnect Rochester hypothesized that different construction and maintenance standards may translate into different crash outcomes.
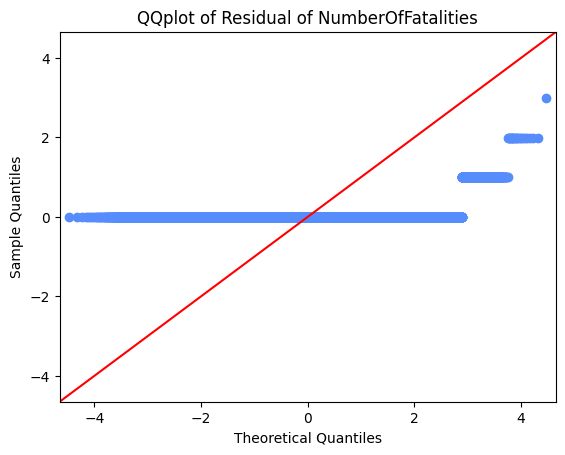
QQ-plots and Shapiro-Wilk tests (p < 0.05) confirmed that FSI counts are not normally distributed, ruling out parametric tests like ANOVA and requiring nonparametric methods.
The analysis used a layered non-parametric approach:
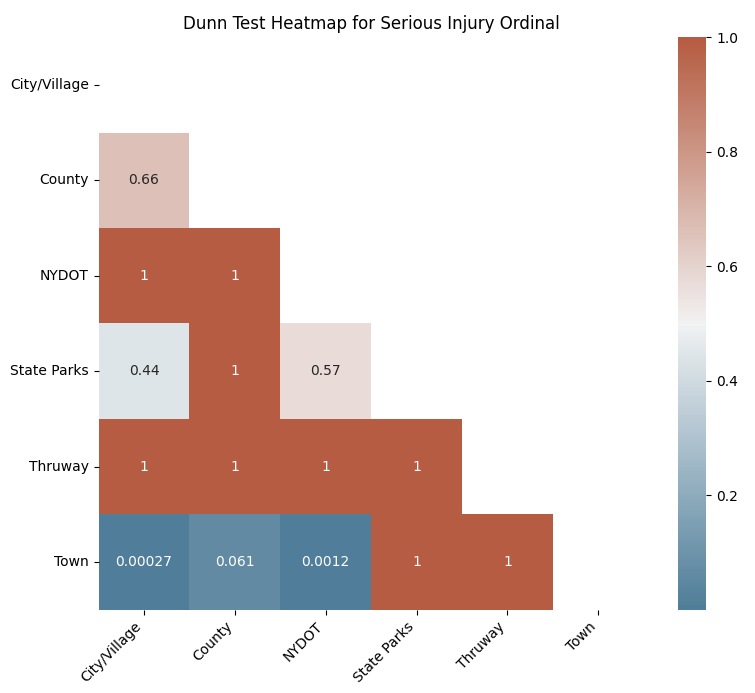
Kruskal–Wallis test to assess whether injury severity distributions differ across any jurisdictions.
Dunn post-hoc test (Holm adjustment) to identify which specific jurisdiction pairs differ.
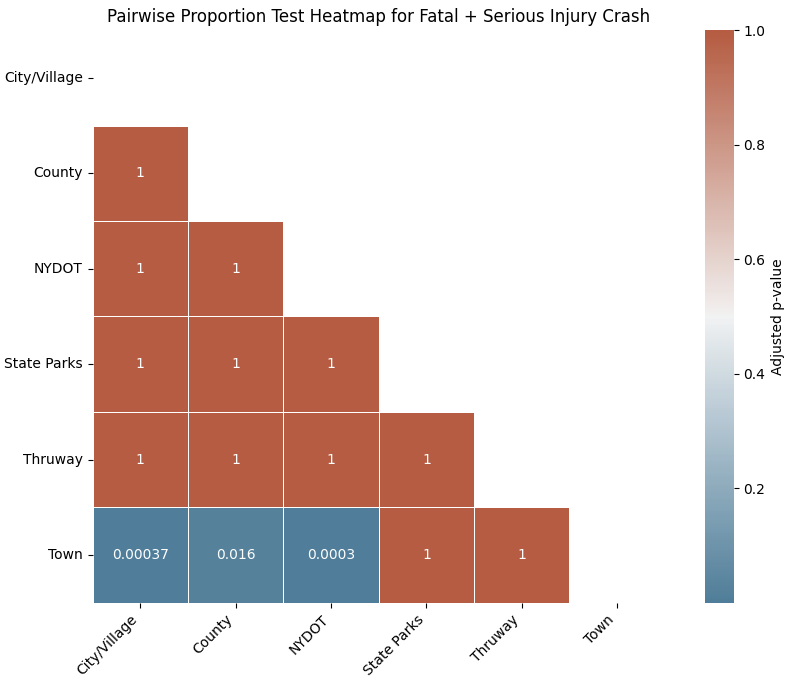
Chi-squared test of independence to test if FSI outcome is associated with jurisdiction, followed by Cramér’s V for effect size.
Pairwise proportion z-tests with Fisher’s exact test (Bonferroni correction): to compare FSI rates across jurisdiction pairs.
Logistic regression to estimate log-odds of FSI for vulnerable vs. non-vulnerable users by jurisdiction.
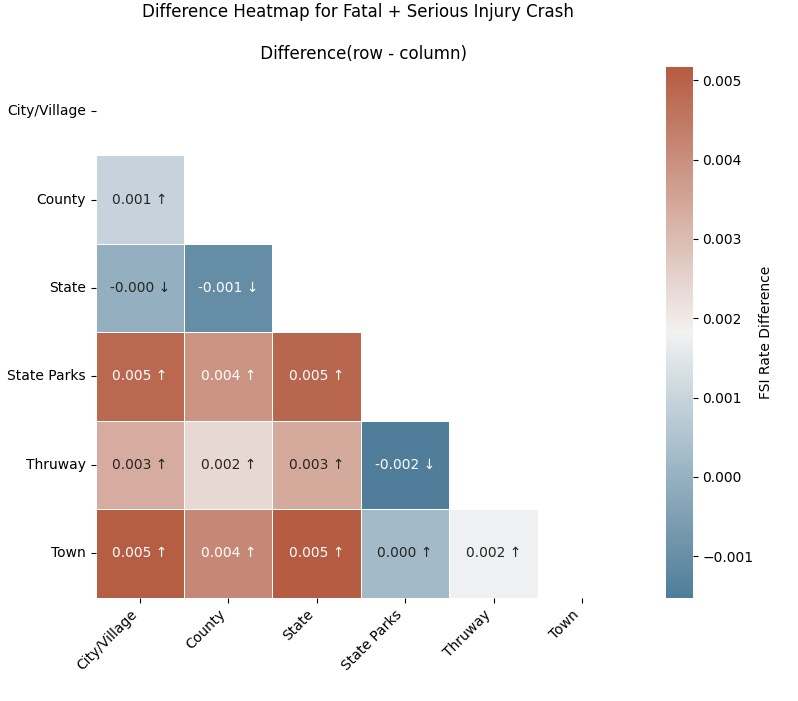
General Population
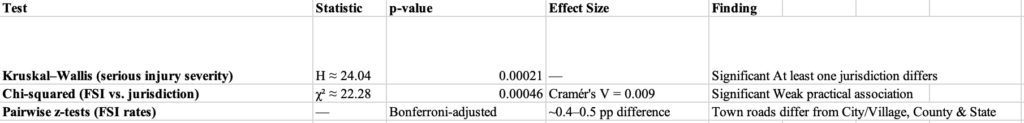
The Dunn test shows that statistically significant serious-injury differences exist primarily between Town roads and City/Village and NYSDOT roads. The FSI rate heatmap reveals that most pairwise differences are small — Town roads have FSI rates only about 0.4–0.5 percentage points higher than other jurisdictions.
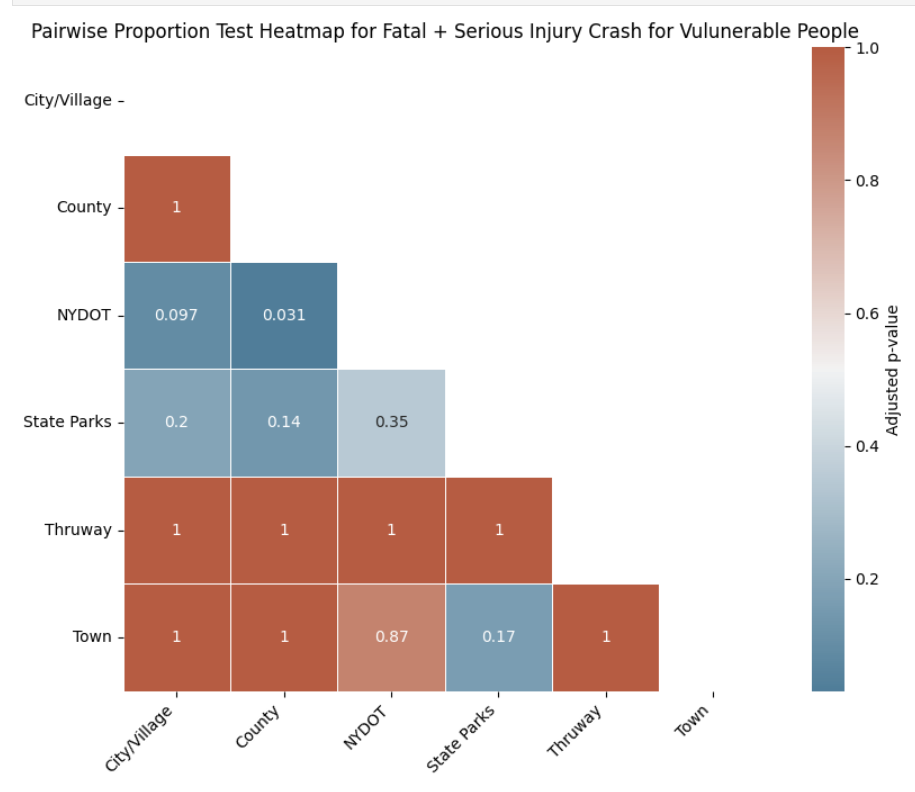
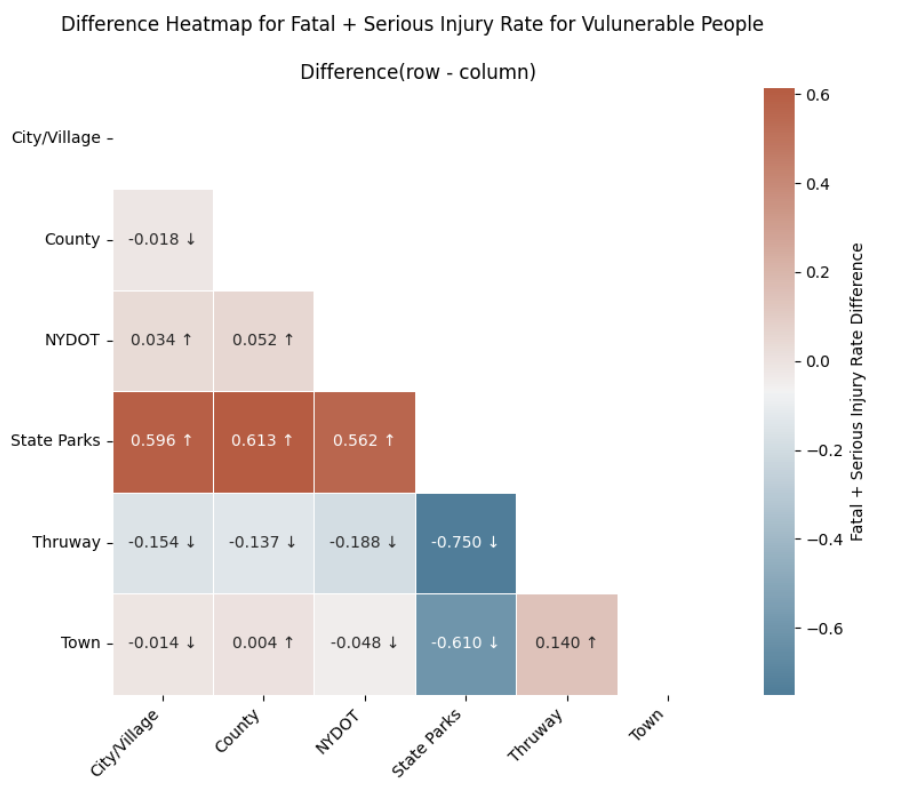
Vulnerable Road Users

For vulnerable road users, NYSDOT-administered roads show a roughly 5 percentage-point higher FSI rate than county roads. State Parks shows even larger apparent differences, but this group’s small sample size makes that estimate unstable.
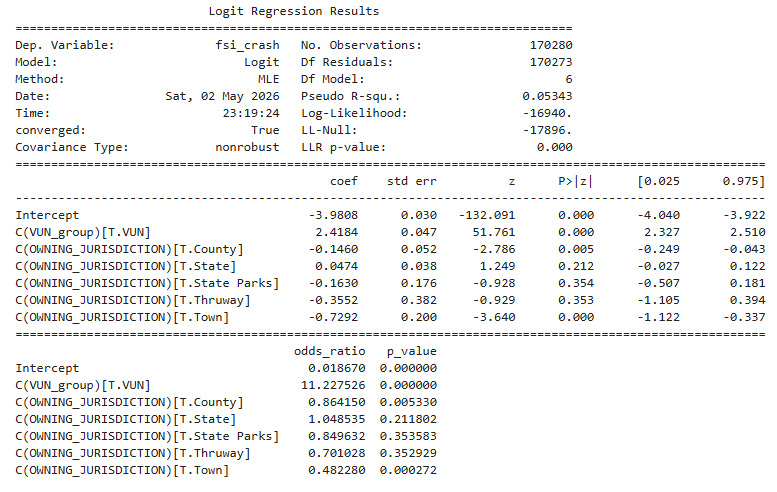
A logistic regression shows that being a vulnerable road user increases the odds of a crash being fatal or serious by approximately 11.23×, controlling for jurisdiction. Within VRUs, the predicted FSI probability is ~17.3% on City/Village roads, ~15.3% on County roads, and ~9.2% on Town roads. Relative to VRUs crashes on City/Village roads, this corresponds to ~ 0.89 times the probability on County roads and ~ 0.53 times the probability on Town roads.
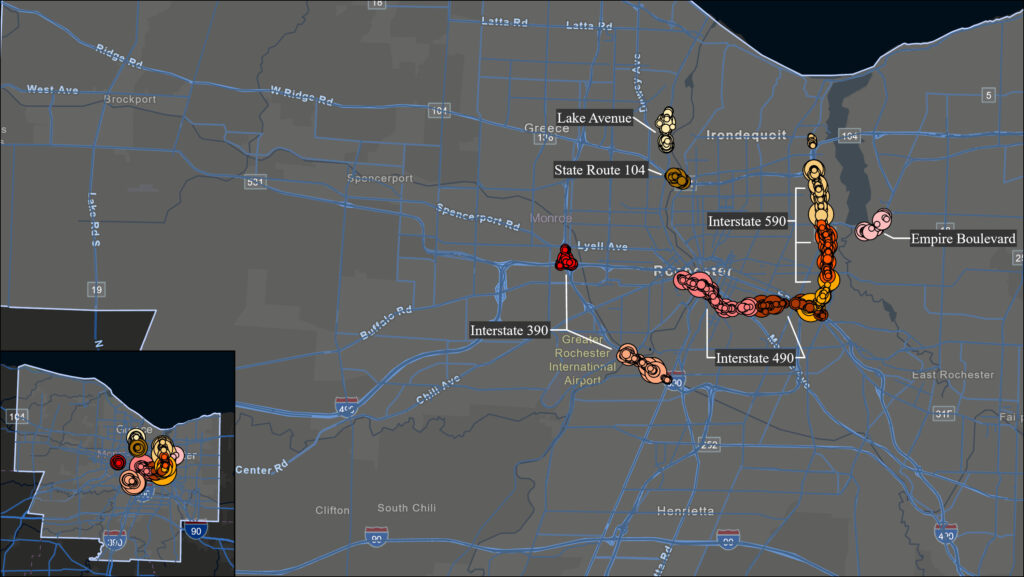
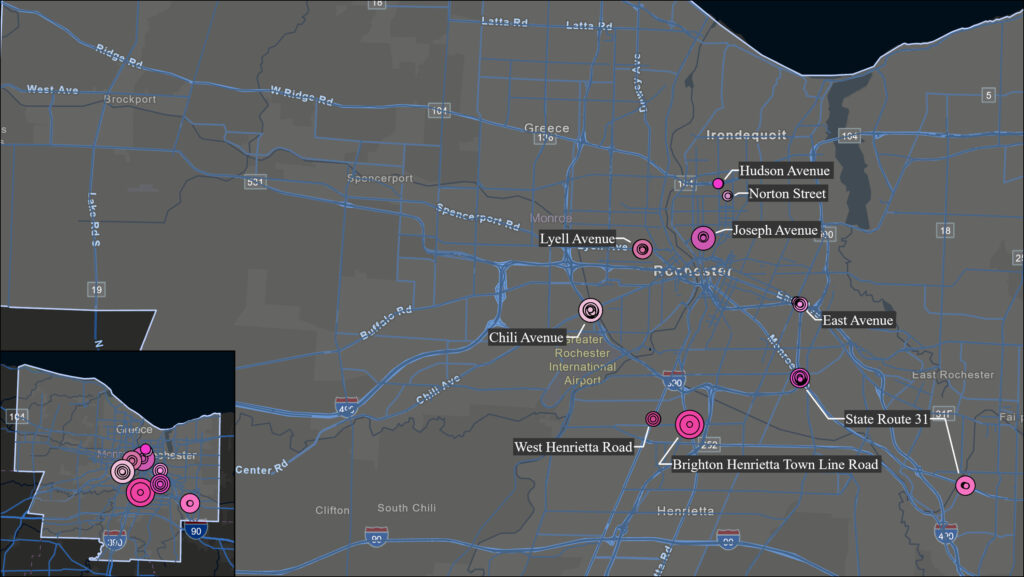
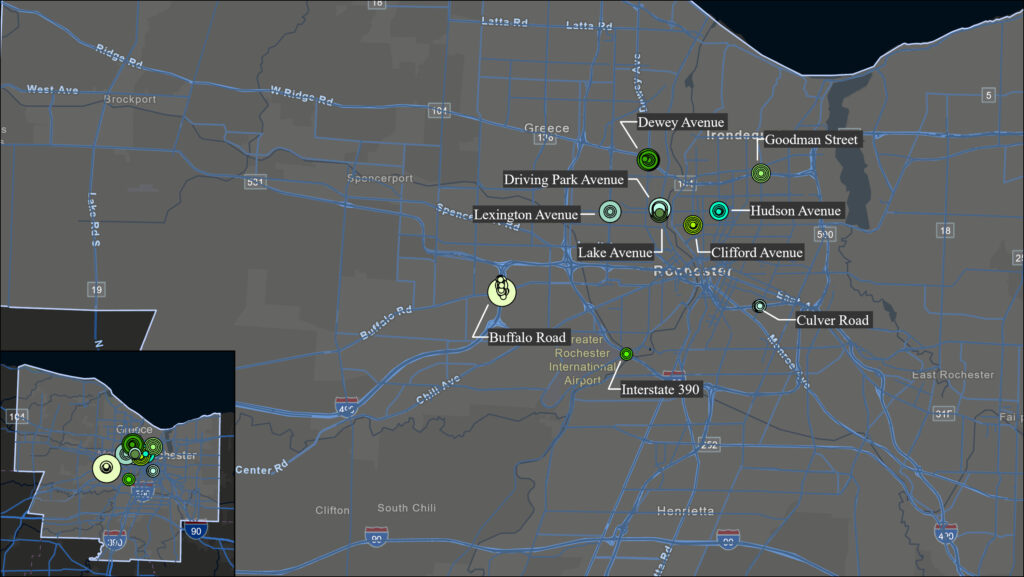
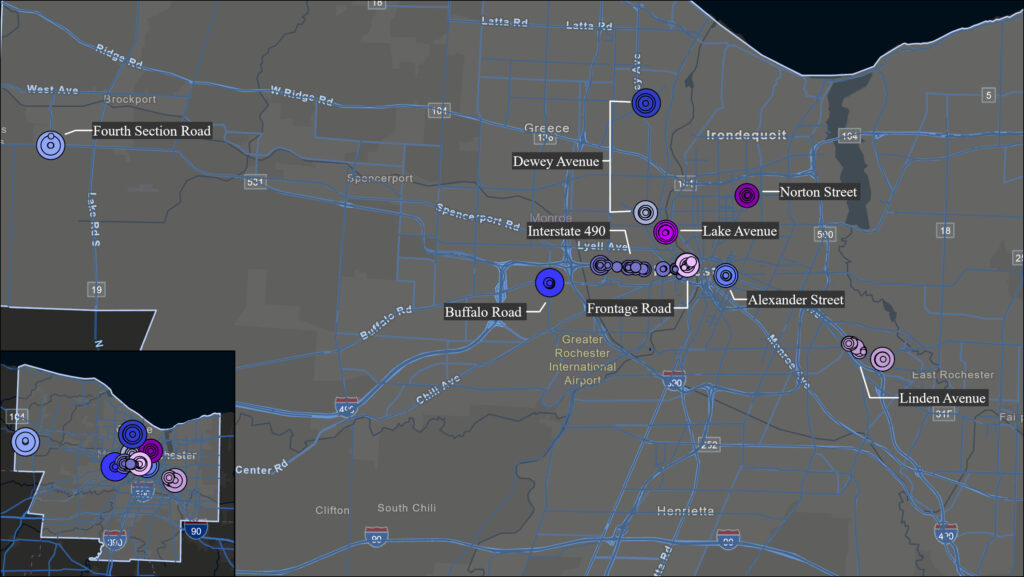
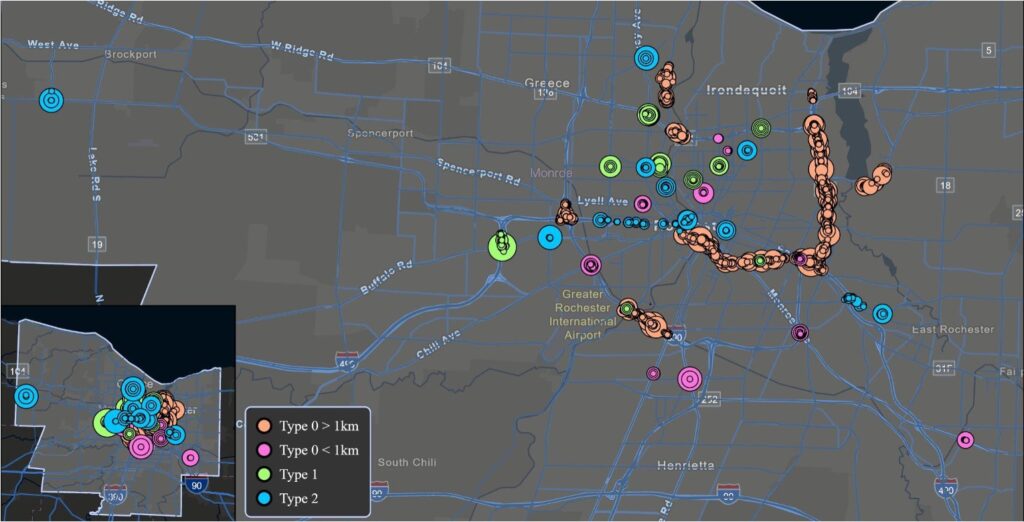
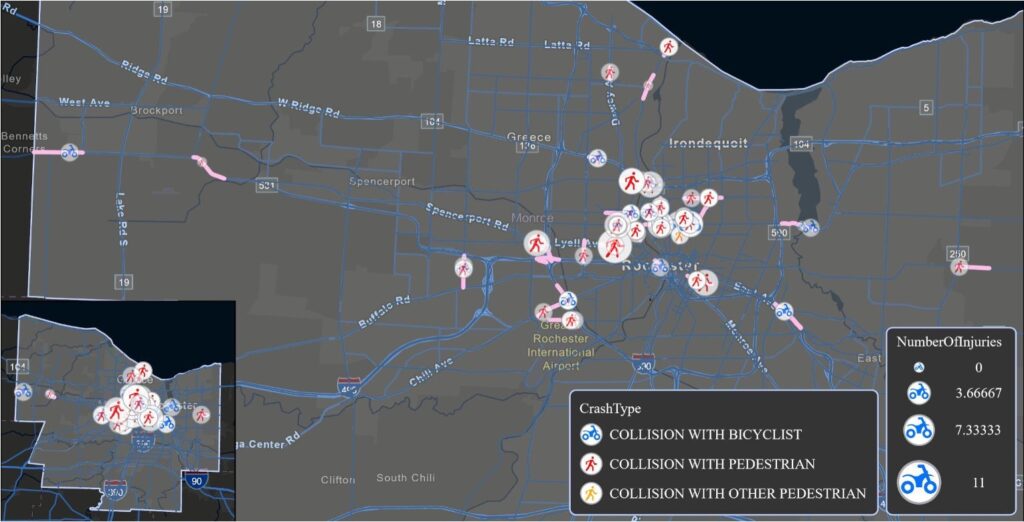
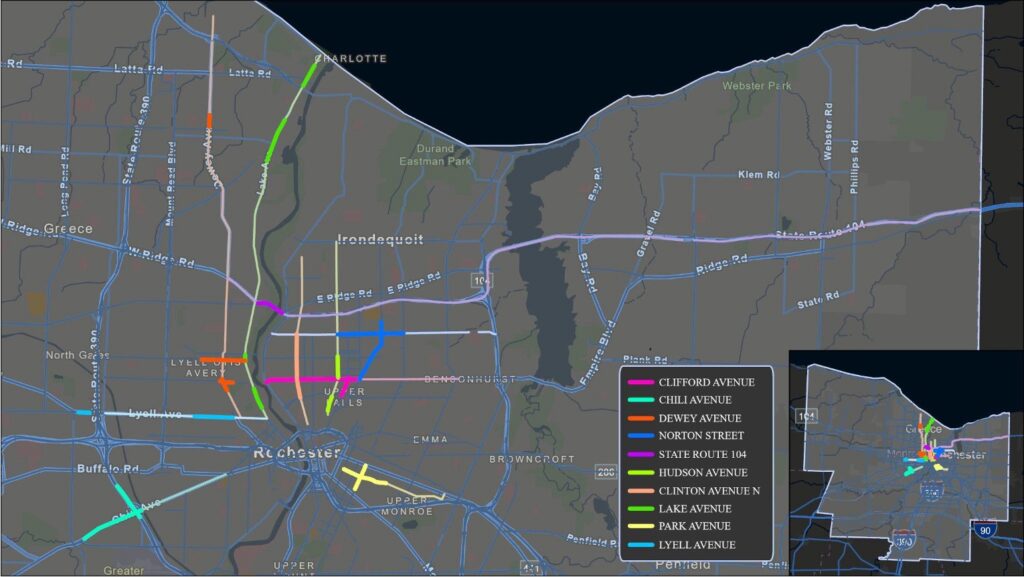
Identifying High Risk Corridor Analysis
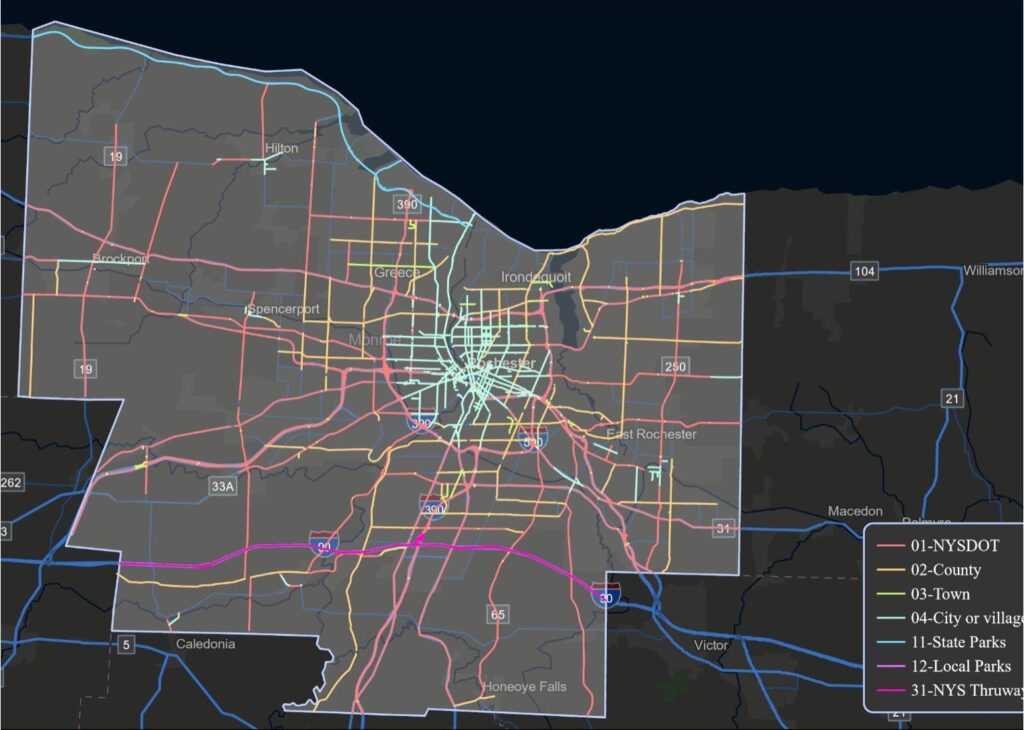
Roads and their jurisdictions
The figures below shows the corridors. The jurisdictions of the roads as well as high risk corridors.
Determining high risk crash corridors that have elevated FSI rates.
Each point is a separate accident, the larger the point the more injuries occurred.
Conclusion
Some of the key takeaways are
- Night hours are disproportionately deadly. Vulnerable road users face the highest FSI risk between 20:00 and 06:00, even though most crashes happen during daytime rush hours.
- Jurisdiction differences are real but modest. There are small yet statistically significant differences in crash outcomes by jurisdiction, particularly on NYSDOT roads. Being a vulnerable road user increases crash fatality odds by ~11× regardless of jurisdiction.
- High-risk corridors have been identified. A systematic spatial corridor analysis has been completed, producing ranked lists of the most dangerous road segments in Monroe County.
- Road project evidence is mixed and limited. Only the East Avenue Road Diet showed a statistically significant change (total crashes, not FSIs), and that finding may be confounded by COVID-19. More data and time are needed for the other projects.
Potential Limitations
- Potential changes in serious injury definitions over the study period were not accounted for
- The COVID-19 pandemic’s effect on traffic volumes and crash patterns was not controlled for, which is especially critical for road project comparisons.
- Traffic flow data was unavailable; adding it would enable more powerful methods such as Empirical Bayes modeling and help normalize for COVID effects.
- For newer projects like the Elmwood Avenue Road Diet, a longer post-project window may be needed before FSI impacts become detectable given the rarity of fatal and serious injury events.
Future work:
Integrate traffic volume data, control for COVID-19, and allow more post-project observation time.
Incorporating an Empirical Bayes model — the methodology used by the Minnesota DOT — would substantially improve road project evaluation accuracy.
Acknowledgements
We would like to thank our customer Reconnect Rochester especially Henry Listsky and Cody Donahue, our advisors Prof. Cantay Caliskan and Prof. Ajay Anand for their guidance throughout the semester.