Team
XINYU CAI
Data Science | Business Analytics
Class of 2022
YAXIN YANG
Data Science | Molecular Genetic
Class of 2022
Minghui Cen
Data Science | Business Analytics
Class of 2022
YILIN ZHOU
Data Science | Biology
Class of 2022
Mentor
Prof. Ajay Anand, Goergen Institute for Data Science
Sponsor
Dr. Erika Ramsdale, URMC
Introduction
Advanced age is the worst carcinogens, causing cancer incidence to rise exponentially in the latter decades of life [1]. Older patients normally have complicated healthy conditions and, in most circumstances, must be reviewed before considering whether to get cancer treatment since both overtreatment and undertreatment are dangerous. The geriatric assessment (GA) assists in diagnosing medical conditions and developing treatment and follow-up plans for older patients from a multidimensional and multidisciplinary perspective [2].
Project Vision
For our research, the goal is to figure out the following two questions:
- Can we use GA-based features to predict the 3-month RDI value?
- Among all 145 features, which ones are important?
Our project is at the beginning phase of the grand research of the Wilmot Cancer Institute’s Geriatric Oncology Research team at the University of Rochester, whose ultimate goal is to increase the effectiveness of chemotherapy in treating older people with advanced cancer.
Project Goals
- Feature selection based on understanding and rigid thresholds
- Predictive models to assess the efficiency of medication features in chemotherapy results
- Refine Data Preprocessing Pipeline
Dataset
The GAP-70 dataset collects information on 718 patients in the US who are above the age of 70 and have been diagnosed with advanced caner. It has one record for each patient and 145 features, including GA-based features and the target variable Relative Dose Intensity (RDI).
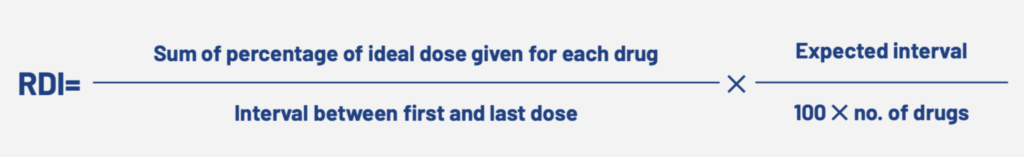
Target Variable: RDI
RDI is an indicator frequently used for measuring and monitoring the quality of cancer treatment. It takes into account both the dosage amplitude and frequency of cancer treatment. It has 77 missing values, reaching a null percentage of 10.6% and being eliminated in our research.
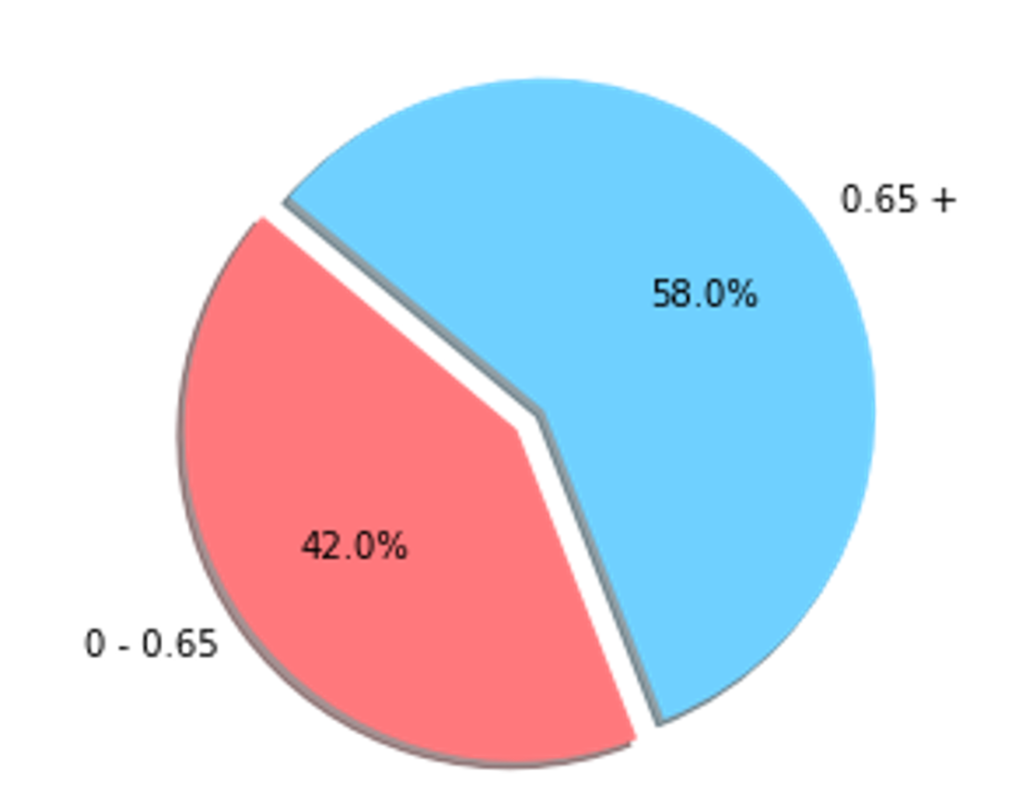
The pie chart shows that having a threshold of 0.65 for the RDI, it has no unbalancing issue.
EDA
- KPS
Karnofsky Performance Status also known as KPS is a standard way of measuring the ability of cancer patients to perform ordinary tasks. The larger the KPS is, the more capable the patient is of performing ordinary tasks.
| KPS Value | Status |
| 0-49 | unable to care for himself or herself |
| 50-79 | unable to work yet capable of living at home and caring for most personal needs |
| 80-100 | able to carry on normal activity and to work |
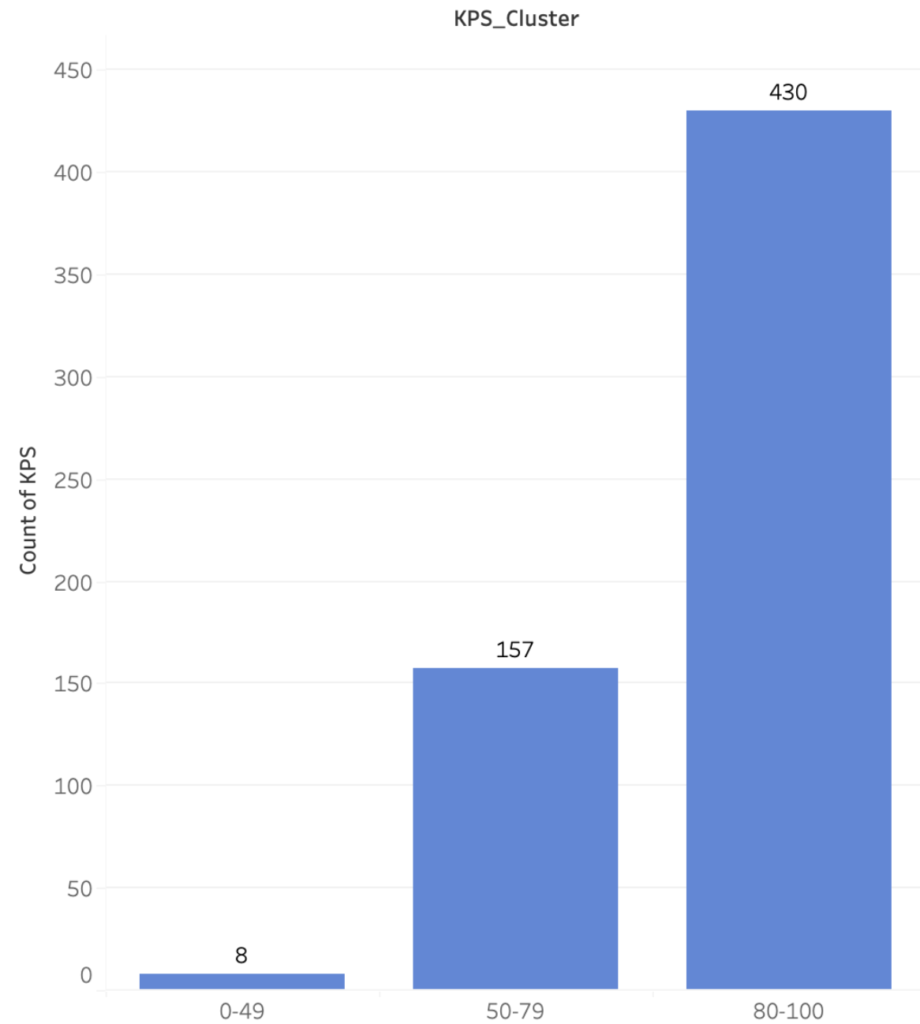
This bar plot shows that 430 patients have a KPS score between 80 and 100, which represents nearly 60% of the patients, but there are only 9 people who have a KPS score below 40 which was not very representative.
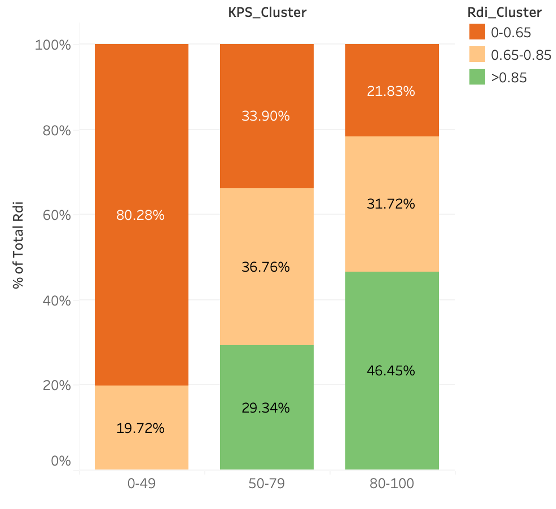
The stacked histogram shows the relationship between KPS and target variable RDI. Approximately 80% patients in the lowest KPS group have RDI values below 0.65. This aligns with the clinician’s understanding as clinicians won’t give chemotherapy to patients who have KPS below 49. Groups with higher KPS have more patients with higher RDI values. For groups between 80 and 100, nearly 50% (46.45%) of patients have RDI above 0.65.
- Treatment Type
Treatment type is a categorical variable, and it is obtained from post-chemo treatment. It can’t not be obtained from patient who haven’t got chemotherapy. Treatment_type variables are divided into three categories: chemotherapy, other treatments, and chemotherapy & other treatments.
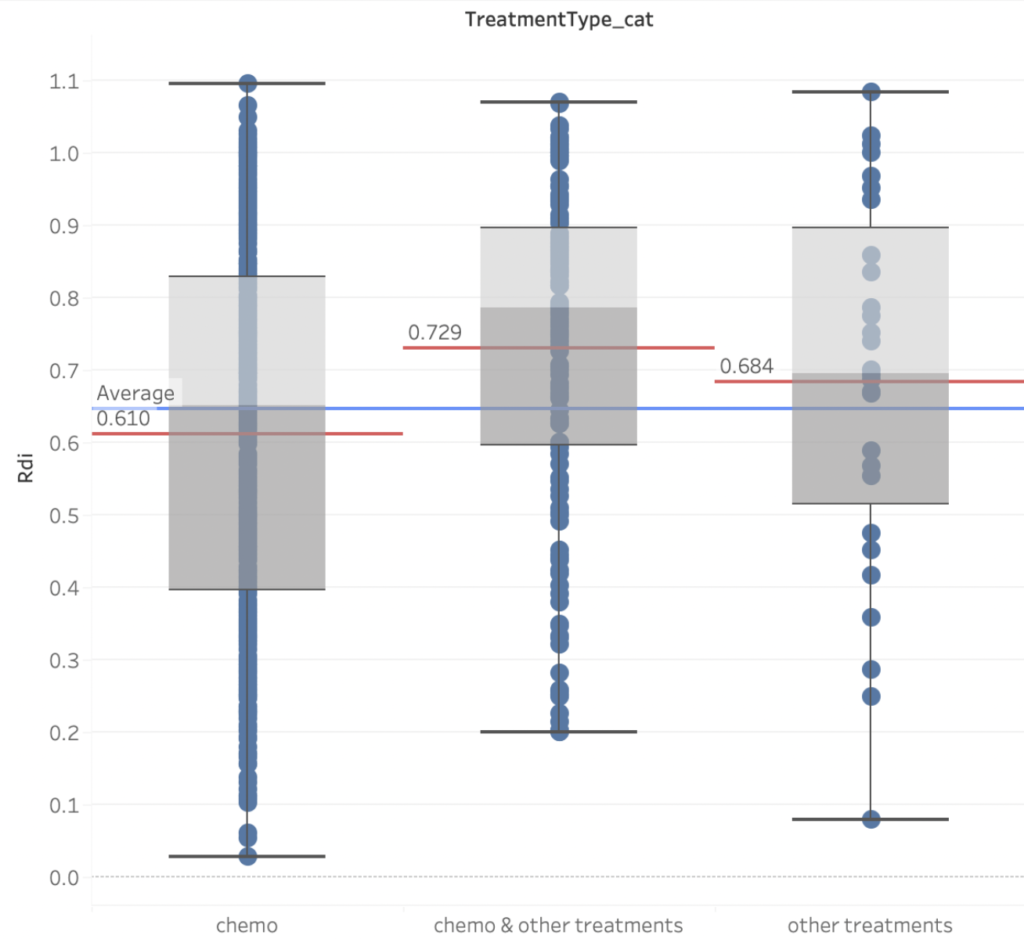
Figure 4 reveals that the RDI of patients who solely get chemotherapy is even lower than the overall average. The best RDI scores come from a combination of chemotherapy and other treatments. When comparing the first two boxplots, it’s clear that the second group has a substantially higher RDI average, implying that other treatments could significantly improve the effectiveness.
- Correlation Heatmap
Many features have high correlation across the diagonal, but notice that they are not the same as the correlation of a column with itself.
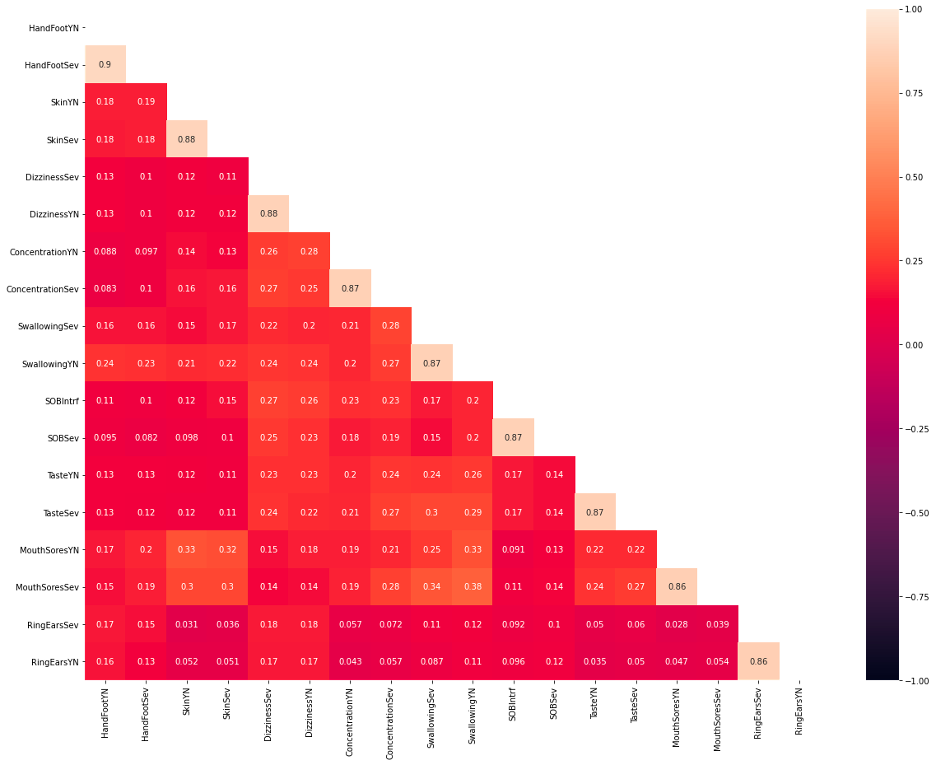
The majority of the features with high correlations are related to symptoms. A symptom is represented by three variables in the dataset. The first is a yes/no binary response that indicates if the patient has the symptom. The second factor is severity, which refers to how serious the symptoms are. Finally, interference refers to how much the symptoms are interfering with the patients’ daily lives. Because the severity and interference columns include more information than the yes/no column, the project chose to omit the binary result columns and prioritize interference above severity. If the specified symptoms do not have an interference column, the project will instead look at severity.
Models
- Naive Bayes
- Logistic Regression
- Random Forest
- Gradient Booster
- K-NN
- Elastic Net
- Forward/Backward Feature Selection
Performance Metrics
- Why Recall?
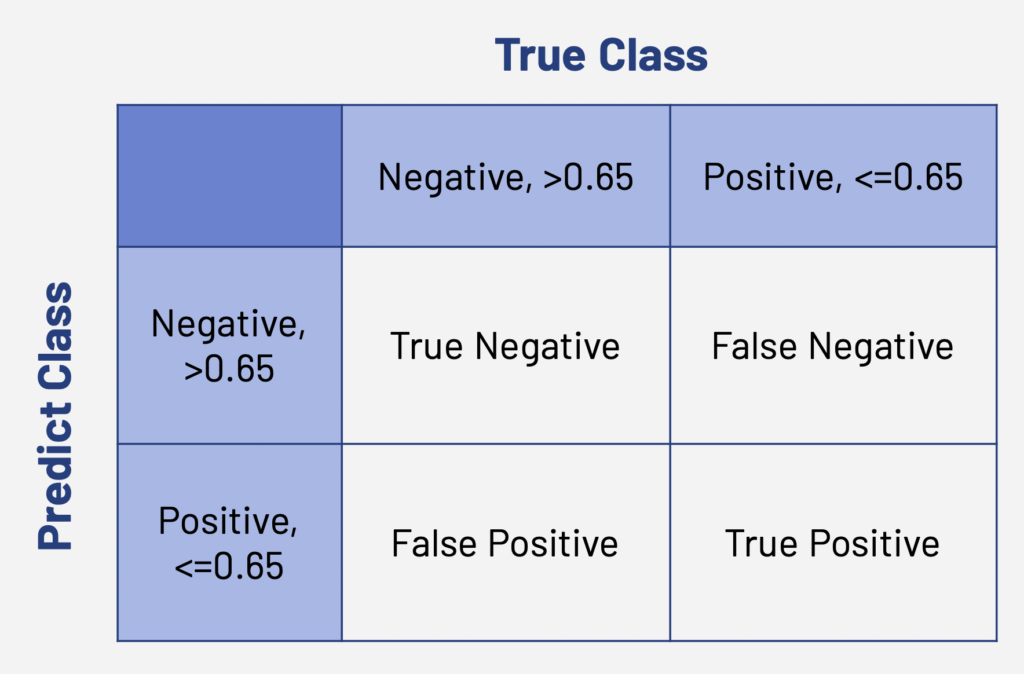

In reality, patients won’t have the RDI value at first. We use models to predict their RDI and decide whether they are able to accept the chemo treatment or not. We don’t want overtreatment on the patients. Thus, we want our false negative value as small as possible and true positive value as large as possible.
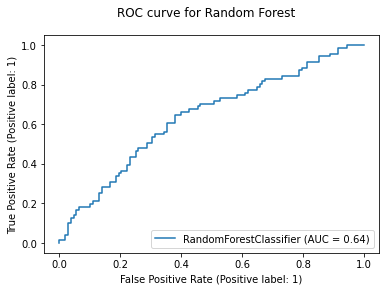
- Why ROC AUC?
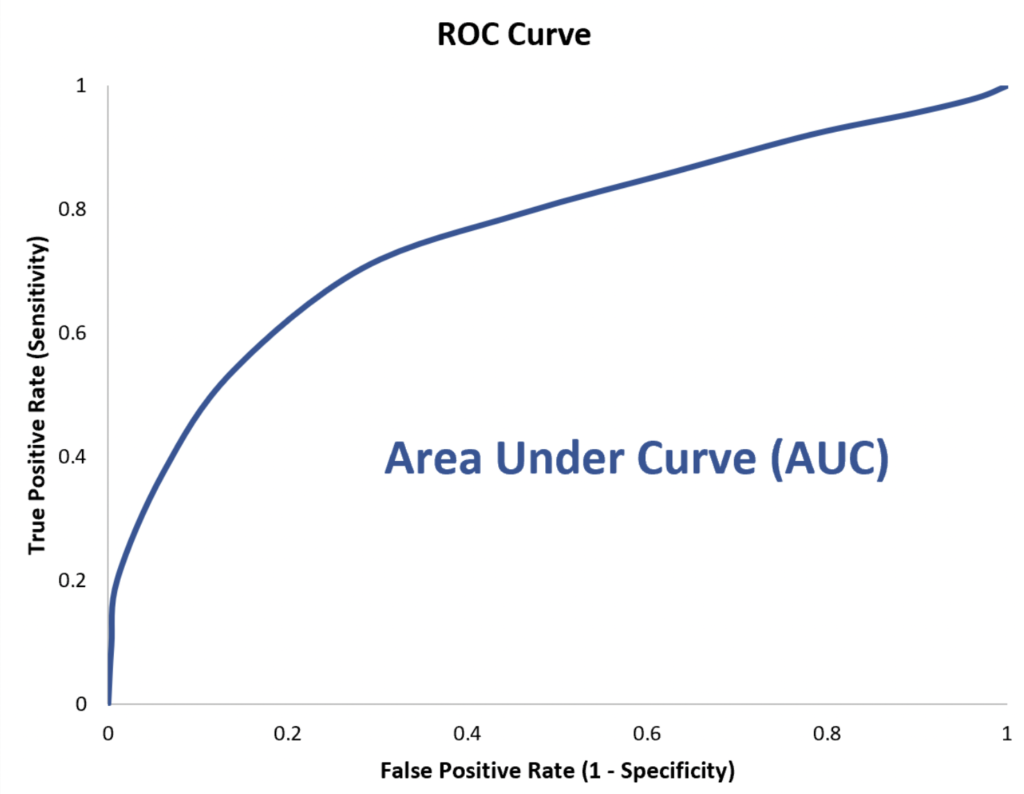
In clinical epidemiology, ROC analysis is widely used to measure how accurately medical diagnostic tests (or systems) can distinguish between two patient states.
Results
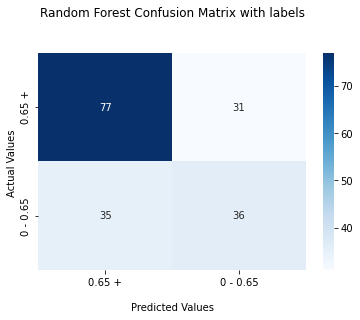
For each model, we would generate ROC curve and confusion matrix. Here, we take Random Forest as an example:
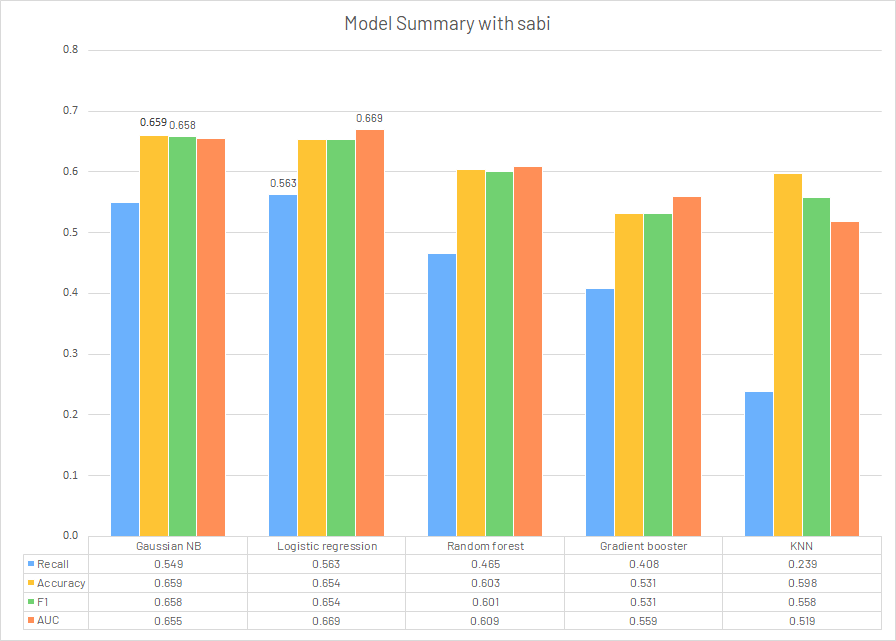
SABI Column
In the latter part of this research, our sponsor gave us a new feature called SABI. It is an integrated numerical column for cancer symptoms, combining all binary results, severity, and interference for symptoms and assigning different weights for different symptoms. It is still under development of the research team. We would redo the modeling using SABI column to replace all the symptom features.
Model Summary
Feature Selection
In order to select the features that are useful in predicting RDI, the project applied 4 wrapper feature selection methods. The final feature set contains the common features that are selected by all methods. Elastic Net was applied to linear regression models in predicting the values of RDI; sequential feature selection was performed on logistic regression model as it is the model with the highest performance; random forest feature importance was utilized to visualize the relative feature importance.
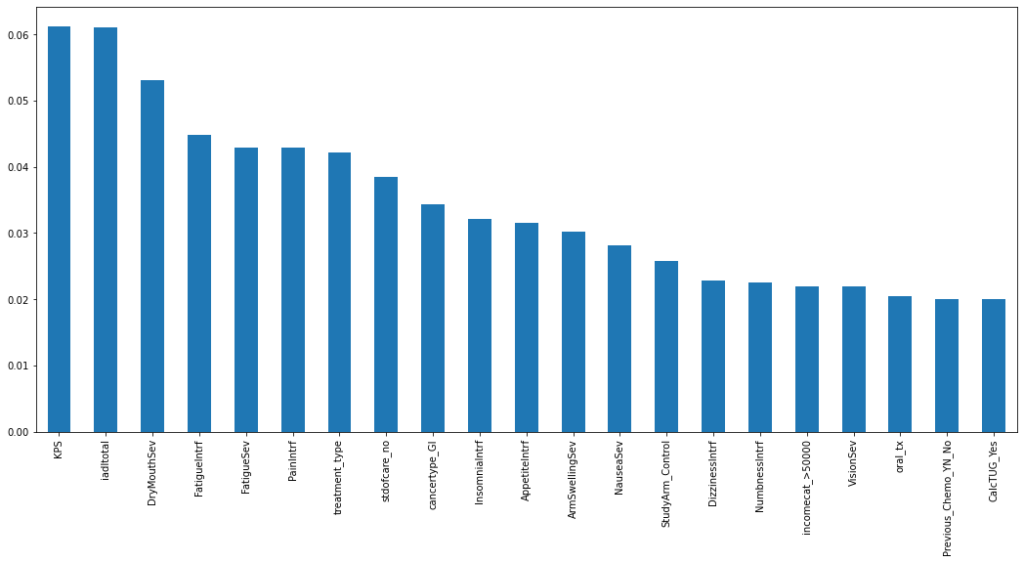
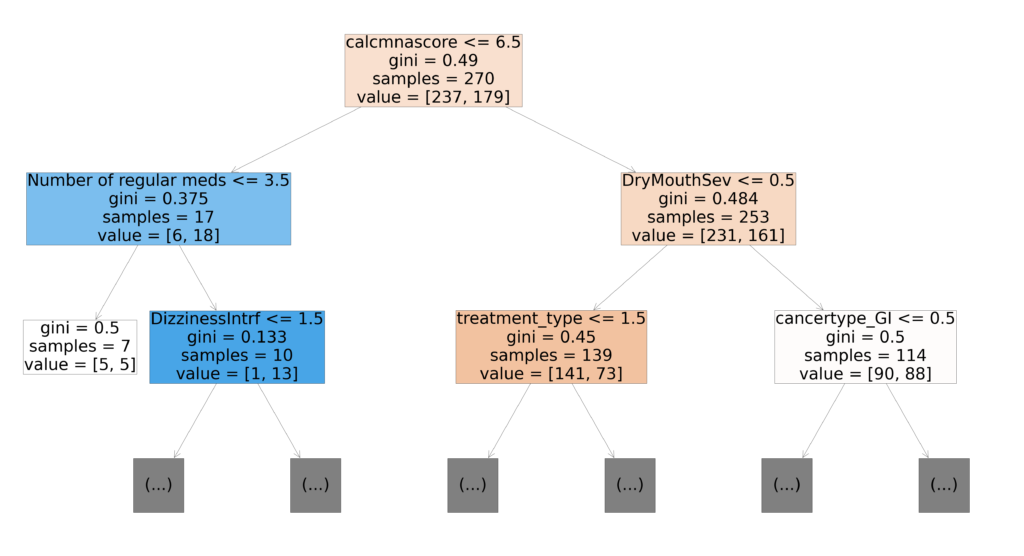
Figure 12 depicts the top 21 features with the highest feature importance derived from the random forest model, which are the features with relative importance greater than 0.02. The RF model was chosen as a model of interest for the project because it provides a clear and easily interpretable visualization of the model’s feature importance ranking. It’s worth noting that the severity of dry mouth was chosen as the third most important feature, but it’s difficult to associate this symptom with the relative dose intensity based on common understanding.
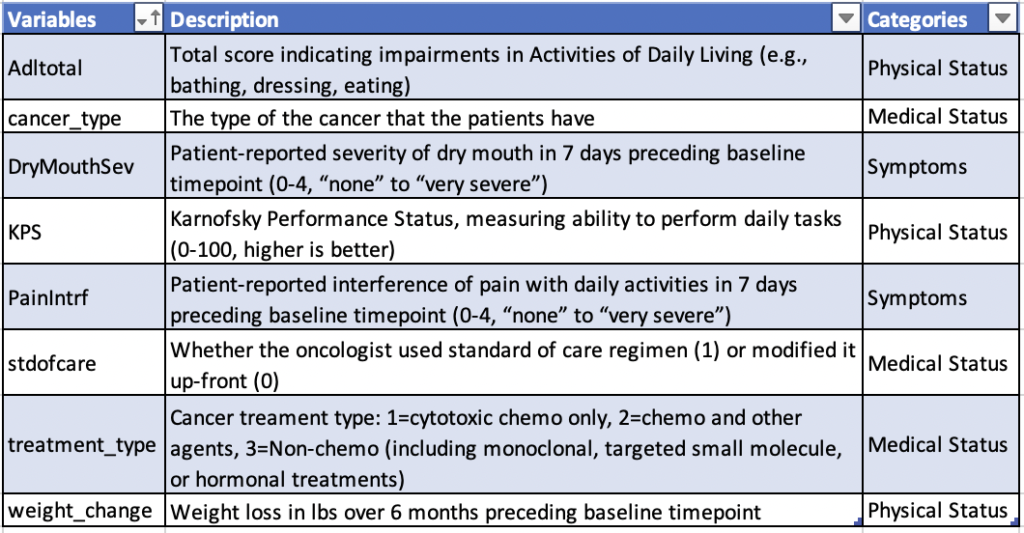
Overlapping Features
We have used three different feature selection methods up to this point: elastic net, random forest feature importance, and forward/backward feature selection. The project then extracted the features that were chosen by all three methods. There are 8 features in total: weight_change, DryMouthSev, Adltotal, KPS, PainIntrf, cancertype, stdofcare, treatment_type. Figure 13 shows the detailed description and the categories of these 8 features. Among these eight features, two (DryMouthSev and PainIntrf) are symptoms; KPS, Adltotal, and weight_change are physical status variables; lastly, cancer_type, stdofcare, and treatment_type are medical record variables. We noticed that no psychological, demographic, or cognition variables were selected. This may provide insights for future data collection.
Data Preprocessing Pipeline Refinement
The pipeline aims to process raw data for physicians who are not familiar with code writing.
Existed Methods:
- Dimension reduction: PCA, NMF, ICA
- K-fold
- Encoder: Label, OneHot
- Imputer: KNN, DropNA, Mean, Median
Added Methods:
- Feature selection: Ridge, Lasso, Elastic Net
Conclusion
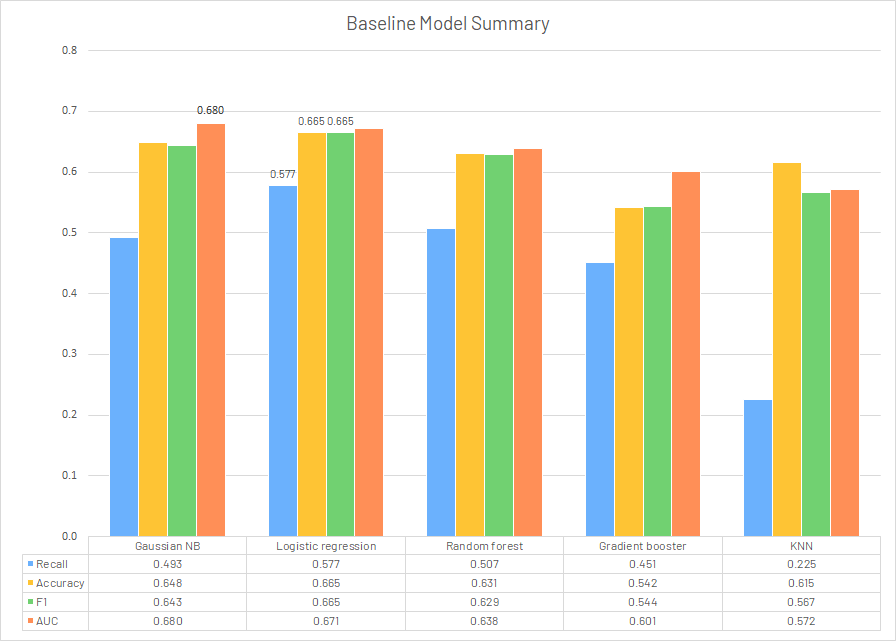
In conclusion, we believe even after modifications, the models using existing GA-based features cannot generate a solid prediction for target variable relative dose intensity. Among all the models utilized, logistic regression returned the best results on the baseline (Recall: 0.577, Accuracy: 0.665, F1: 0.665, AUC: 0.671). The replacement of all symptom features with SABI column didn’t give a significant improvement on the performance metrics. Since it is still under development by the research team, it would probably make some difference after modifications and trials.
Another issue is the limitation of dataset. The missing value reached a percentage of 10.6% for the target variable RDI, which was not ideal for our research. The possible solution is to collect the RDI as complete as possible in future studies, or could use the standard of care, representing whether the patient receiving the standard dose level or not, with a missing percentage <1% as the target variable [3].
Though current models provided acceptable test results, they could not provide constructive suggestions to clinicians. But we still hope that this research could provide some insightful ideas to future studies. First, this project added some new data preprocessing method to the pipeline, which might be utilized in future use of softwares in the cancer treatment process, providing more methods to select for clinicians. In addition, our project is at the first few phases of the overall cancer project for older people at the Wilmot Cancer Institute, the feature selection results could also point out insightful directions in future data collection. It is very time-consuming and costly to collect data from patients. Based on the overlapping results of feature selection, we hope that the geriatric assessment could emphasize more features on the physical status of older patients since it could be used to investigate their potential status of having chemotherapy. For the features related to self-assessment, we hope that they could be replaced with some objective evaluations standardized by physicians. Under this circumstance, the geriatric assessment would still monitor and assess features from various domain but with a more accurate and objective perspective. These conclusions could provide insightful suggestions to the future studies on the investigations related to GA-based features of older patients with advanced cancer and the effectiveness of chemotherapy.
Acknowledgement
We appreciate the help from our project mentor Prof. Anand from GIDS and our sponsor Dr. Ramsdale from URMC.